Most Kubernetes engineers recognize the reactive nature of remediation and the diminishing returns of manually managing resources in a rapidly growing cluster. Operations may start smoothly, but as cluster complexity grows, too many workloads require manual tuning, recommendations pile up in the dashboard, and the team wastes engineering time on an approach that does not scale.
Engineers need an automated, trustworthy way to optimize resource usage.
This article explains automated Kubernetes resource optimization strategies for cost-efficient scaling.
Summary of key Kubernetes resource optimization concepts
| Concept | Description |
|---|---|
| CPU requests | CPU requests set the scheduler’s placement decisions and define the pod’s share of node CPU time. CPU Limits trigger throttling when exceeded, but do not cause eviction. |
| Memory requests | Unlike the CPU, memory cannot be throttled.Memory limits cause container termination (OOMKilled) when breached. The buffer between requests and limits directly determines the risk of crashes during load spikes. |
| Resource consumption measurement challenges | Prometheus, with “kube-state-metrics” and “metrics-server”, provides pod-level CPU and memory data. Meaningful rightsizing requires aggregating usage across representative time windows that capture:
|
| Translating usage data into safe request values | Metrics do not fully capture measurement granularity and short bursts. Hence, converting usage percentile data into requests requires applying headroom multipliers to the chosen target percentile (typically p90 or p95 for CPU, p99 for memory) |
| Limitations of the Vertical Pod Autoscaler | VPA automates recommendation generation and can apply changes directly. However, it requires pod eviction to update resource specs. It is disruptive for stateful workloads and poorly suited to applications that cannot tolerate restarts during traffic. The VPA bases recommendations on static percentiles, which do not sufficiently predict resource needs. |
| Continuous rightsizing with ML-based tools | Machine learning models trained on workload-specific usage patterns generate recommendations that account for time-of-day variation, seasonality, and deployment events that static percentile calculations miss. They reduce both over-provisioning waste and crash risk simultaneously. |


Automated vertical autoscaling designed to scale for 100K+ containers

Fully compatible with HPA functionality and cloud-based services

Powered by advanced machine learning with user-controlled guardrails
CPU request and throttling mechanics
CPU is a compressible resource.
CPU limits – invisible throttling
When a pod exceeds its declared CPU limit, the Linux kernel throttles it within a 100ms scheduling period, restricting the container’s available CPU time without terminating it. The pod continues running. Health checks continue passing. However, any request that arrives during a throttling period incurs additional latency, with no obvious cause in the standard monitoring output.
CPU limits are, therefore, a common source of performance degradation that do not surface in crash reports or operational alerts. The Prometheus metric container_cpu_cfs_throttled_seconds_total can identify this scenario by showing how much time each container spends throttled. A rising rate on that metric indicates the limit is set too low, regardless of what average utilization charts show.
CPU requests – granularity challenges
CPU requests indicate how much CPU to reserve for each pod when the scheduler determines node placement.
- Underspecified requests lead to node overpacking. Placement decisions are based on artificially low estimates, resulting in real contention on the node under load.
- Overspecified requests inflate node requirements and hold capacity that could serve other workloads.
The objective is to set requests at approximately the 90th percentile of the typical operating range. For this, you need accurate monitoring data over a sustained period.
ML-based granularity management
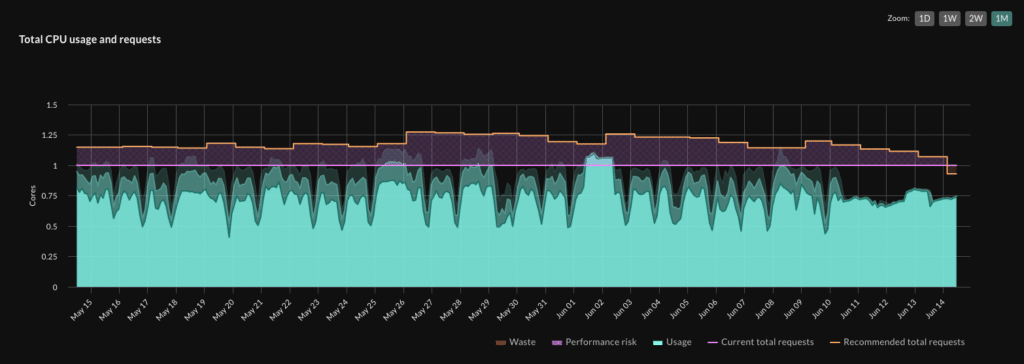
One operational advantage of ML-based platforms like StormForge by CloudBolt is their approach to this granularity problem. StormForge collects workload metrics at 15-second intervals and uses machine learning to distinguish sustained operating demand from burst behavior that occurs between Prometheus scrape windows. As a result, the CPU request recommendations reflect the workload’s true sustained resource usage profile rather than an averaged view that obscures short-duration spikes.
An example CPU resource usage profile from StormForge is shown below:
| Solution | Rightsizing recommendations | Automation | Fully compatible with HPA | Powered by machine learning | Historical metrics analysis | Trend forecasting |
|---|---|---|---|---|---|---|
| VPA |  |
|
 |
|
|
|
| StormForge | |
|
|
|
|
|
Memory request and limit behavior
Unlike CPU usage, memory is not compressible.
Memory limits – sudden shutdowns
A container exceeding its memory limit triggers the kernel’s cgroup OOM killer. The kernel then sends a SIGKILL to a process within the cgroup. There is no throttling period and no opportunity for graceful shutdown.
The kubelet reads the container status from the runtime and reflects it as OOMKilled (exit code 137). While this is useful as a post-mortem diagnostic it is not an actionable signal. Sizing memory, therefore, requires a slightly different approach from sizing the CPU.
Memory request challenges
Memory requests indicate how much memory to reserve for each pod when the scheduler determines node placement. Memory requests determine eviction priority during node pressure. Kubernetes evicts pods whose actual memory usage most `exceeds their declared request first. A pod with accurate memory requests is more likely to survive a neighboring pod’s memory leak. A pod with understated requests may be evicted even when its own behavior is within normal bounds.
Asymmetry matters when sizing the buffer between a memory request and its limit.
Different workloads also have different memory requirement profiles.
- JVM-based services have garbage collection pause behavior that temporarily elevates memory usage above steady state.
- Services that warm caches on startup will show elevated memory consumption during initialization before settling into their normal footprint.
- Workloads that process variable-size payloads will have memory profiles that shift as traffic composition changes.
Setting memory requests at the 99th percentile of observed usage and applying a 1.2x to 1.5x headroom multiplier is a reasonable starting point. Workloads with infrequent but significant spikes may require a higher multiplier.
JVM challenges
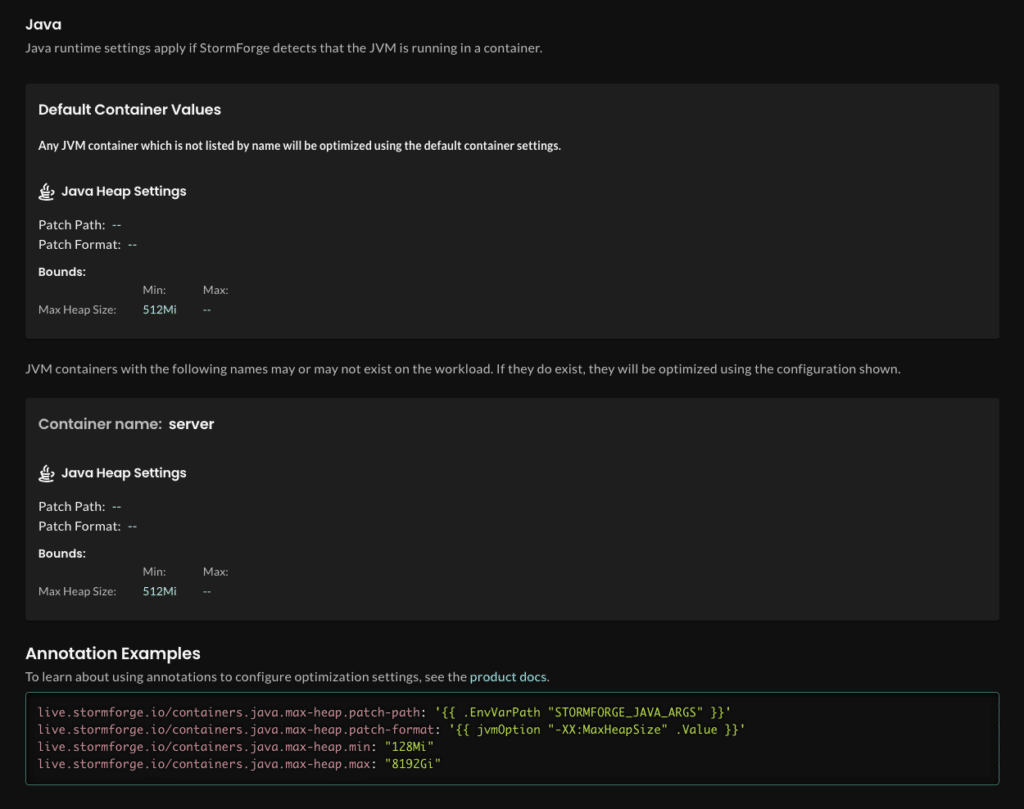
For Java workloads specifically, the challenge runs deeper: the JVM’s maximum heap setting interacts with container memory limits in ways that standard Kubernetes tooling does not expose. Undersizing either value without understanding this relationship frequently results in OOM kills that are misdiagnosed as application defects rather than configuration errors.
ML-based Java heap optimization
StormForge includes dedicated Java heap optimization that models the relationship between heap configuration and container limits, and generates recommendations that account for both:
Resource consumption measurement challenges
Manual optimization efforts fail not in the percentile calculation, but long before it, in the data to which the calculation is applied. Seemingly small oversights in this analysis can cause disproportionate pain for operational support teams.
Collection window challenges
Consider how a 7-day collection window captures weekly traffic patterns but misses daily or even hourly traffic variation. Generating a single recommendation for a week’s worth of usage might work for very static environments, but when business hour windows or high traffic days (think Friday and weekend traffic for ride-sharing apps) require specific treatment, a single request to cover an entire week falls short. If a team rightsizes from a 7-day window that excludes daily variance, steady state activity will weigh down requests that should be higher for the days applications need them, resulting in OOM kills whose root cause is not immediately apparent.
Resource profiling concerns
Workload classification matters before any calculation begins. Steady-state API services, nightly batch jobs, and event-driven consumers have fundamentally different resource profiles that require distinct percentile targets, headroom multipliers, and observation windows. Applying uniform rules across dissimilar workload types produces incorrect results for most of them.
The practical minimum for production rightsizing is 7 to 14 days of data, analyzed with consideration for patterns and seasonal trends. The analysis must also be applied to workloads categorized by type. Anything shorter is a structured estimate, not a right-size.
ML-based automated workload detection
One advantage StormForge brings to this problem is automated workload detection and classification. It automatically detects native Kubernetes workloads (Deployment, StatefulSet, DaemonSet, etc.) and, by default, includes the includeCommonAddOnResourceKinds flag, which adds support for common operators such as Argo Rollouts, Prometheus, Dynatrace, and KEDA. Custom workload types can also be defined to reflect in-house operator CRDs or common custom resources such as the GitHub Actions Runner Controller (AutoscalingRunnerSet).
Rather than requiring platform teams to manually segment workloads before applying percentile calculations, StormForge’s ML model builds a usage profile for each workload individually. The profile automatically accounts for time-of-day patterns, day-of-week variation, and deployment events without requiring those categories to be defined in advance.
Translating usage data into safe request values
Once sufficient data has been collected across an appropriate observation window, converting it into resource specifications requires combining percentile selection with workload-specific headroom.
For CPU, the p90 (90th percentile) of historical sustained usage is a reasonable baseline for steady-state services. It reflects typical operating demand while providing headroom for normal variation without requiring the limit to absorb every burst. For memory, p99 is the more appropriate baseline because the consequences of undersizing are asymmetric: CPU throttling degrades performance, and memory undersizing terminates the workload.
Headroom multipliers address measurement gaps and tail behavior that percentile calculations do not fully capture. A 1.2x multiplier on p95 usage is a common starting point. Workloads with high variance, documented burst patterns, or infrequent large spikes may require p99 plus 1.5x or higher. These are not universal constants, but starting points that must be validated against actual traffic before being applied to production namespaces.
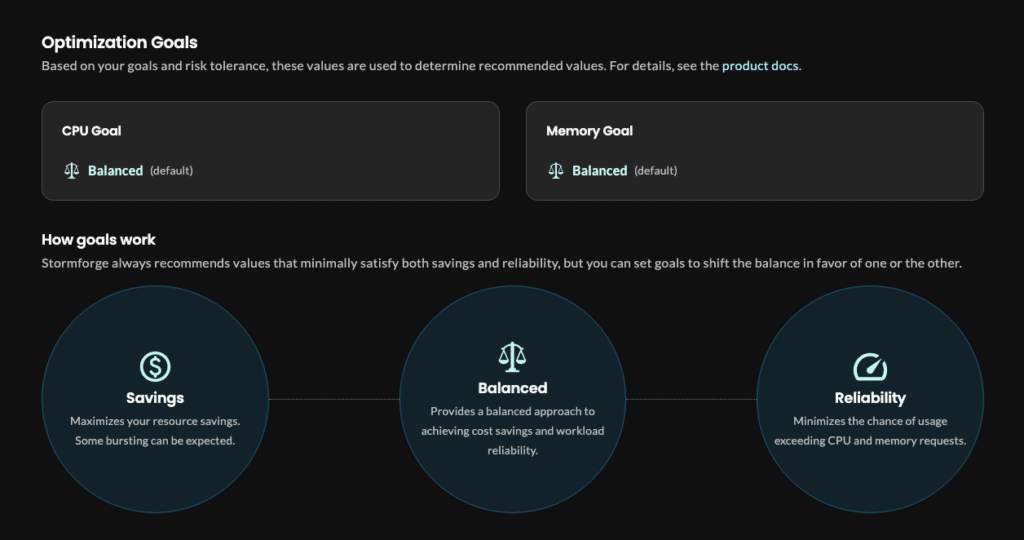
Configuring optimization goals
StormForge’s configuration model maps directly to this challenge. At the cluster level, teams define an optimization goal: Savings, Balanced, or Reliability. This provides the recommendation engine with a hint on how to balance cost and reliability when generating suggestions. A reasonable default practice is to apply:
- Savings goal to non-production environments
- Balanced to production
- Reliability to namespaces containing mission-critical workloads.
These defaults can be overridden at the namespace or individual workload level, which gives platform teams the flexibility to apply different risk tolerances across a single cluster without maintaining separate configuration sets.
It is essential to validate these settings for production use. Test and staging environments often do not carry a representative load, and load testing against rightsized values takes time that competes with other priorities.
However, the cost of skipping validation is paid in production incidents, which are consistently more expensive than a staged validation run.
Limitations of the Vertical Pod Autoscaler
The Vertical Pod Autoscaler (VPA) automates the recommendation generation and application cycle that would otherwise be implemented manually. The production adoption rate, however, remains low (around 1%), and the reasons are structural rather than incidental.
VPA in Auto mode applies updated resource specifications by evicting the current (undersized) pod and allowing it to restart with the new values. For stateless workloads with fast startup times and no warmup requirements, this is an acceptable trade-off. However, for stateful services, long-running batch jobs, and applications with significant initialization latency, pod eviction during live traffic is not viable.
This is why many teams deploy VPA in recommendation-only mode, functionally equivalent to operating without VPA at all.
VPA’s recommendation algorithm compounds the problem by the way it models historical usage. Rather than averaging, VPA maintains a decaying exponential histogram of observed resource usage per container and derives recommendations from the histogram’s percentiles.
Sparsely occurring spikes are missed by either the coarseness of the percentile buckets or the temporal decay. So, recommendations look correct on average, but because the VPA mechanism specifically underweights low-frequency, high-magnitude events, those recommendations can fail in real situations.
The conflict with the Horizontal Pod Autoscaler (HPA) is also well-documented. The HPA scales replica count based on resource utilization relative to declared requests. When the VPA modifies those requests, it changes the denominator in the HPA’s utilization calculation, shifting the scaling baseline unexpectedly. The result is oscillation:
- VPA raises requests, which changes
- the HPA scaling signal, which changes
- replica count, which changes
- per-pod load, which changes
- the VPA’s view of required resources.
Both controllers operate as designed, but neither has visibility into the other’s decisions. The platform team must then investigate and address the resulting instability.
Continuous rightsizing with ML-based tools
Generating rightsizing recommendations is no longer the hard part of the problem. The primary barrier at production scale is not knowing what the right values are. It is trusting an automated system enough to allow it to apply those values in a live environment.
In a March 2026 Stormcloud survey, 89% identified automation as mission-critical and 82% reported high trust in automated delivery controls. But trust narrows sharply when automation touches production.
- 71% say they require human review before automated resource optimization is trusted.
- 27% allowed changes to be auto-applied within guardrails.
- 17% describe their organization as having reached continuous automated optimization as their standard approach.
One practitioner’s comment in the survey captures the dynamic precisely: “A recommendation might be technically perfect, but if it touches a service owned by a team that had a major incident six months ago, that team is not touching their resource settings for a year – full stop.”
This caution is not irrational. Engineers who have experienced OOM kills, cascading failures, and SLO breaches caused by earlier optimization tooling have legitimate reasons to move carefully.
The problem is that at scale, that caution becomes its own failure mode. At 50 pods per cluster across 100 clusters, the volume of potential optimization decisions per day far exceeds what any team can review manually. The 69% of respondents who said manual optimization breaks down before 250 changes per day are describing a threshold most enterprise teams have already passed.
The answer to this hesitation is not a better recommendation algorithm. It is a trust model built into the platform itself.
StormForge is designed around this reality. The system enters an advisory-only mode during an initial observation Learning Period, collecting workload metrics at 15-second granularity and surfacing recommendations without applying anything. Teams can review those recommendations against their own expectations before any automated action is possible.
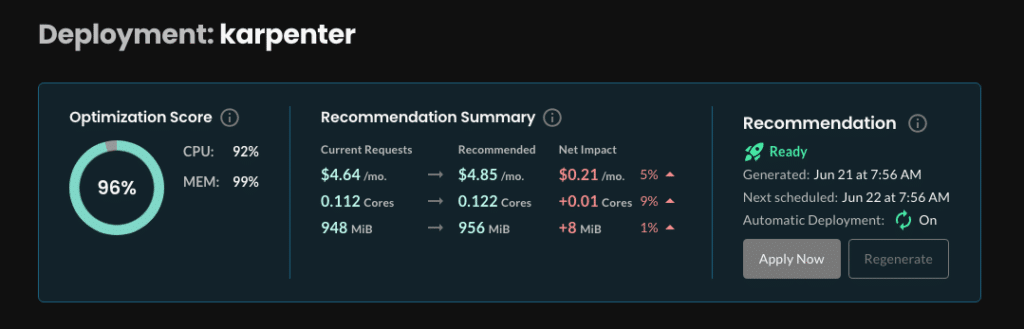
After that observation period, teams choose their rollout model via Apply Settings:
- On-demand application through the UI or CLI.
- Automatic application within configurable guardrails.
- Export to existing CI/CD pipelines via GitOps integration with tools like Argo CD.
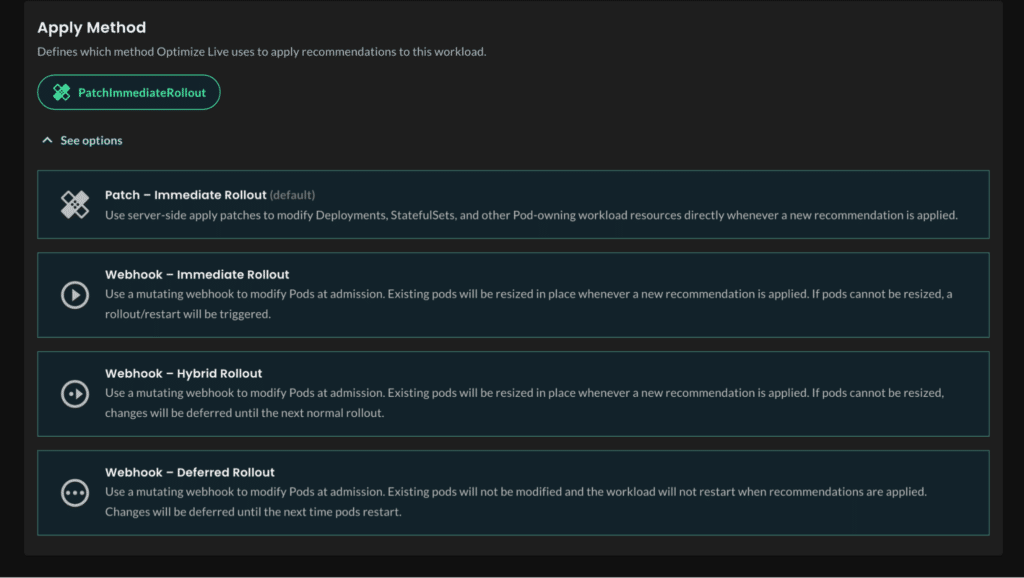
The technical architecture reinforces the trust model at each layer. Unlike VPA, which requires pod eviction to apply changes, StormForge uses in-place pod resizing where supported, with configurable fallback strategies.
- The Immediate Rollout mode resizes in place and falls back to a controlled restart only when the kernel cannot accommodate the change.
- The Hybrid Rollout mode resizes what it can in place and defers remaining changes to the next natural deployment cycle.
Each rollout strategy can be configured per namespace, per workload, or across user defined groups of workloads based on labels, workload type, and other characteristics, allowing teams to match the approach to the actual risk profile of what is running in that context.
The HPA conflict that makes VPA impractical for services that use horizontal autoscaling is resolved at the architectural level. StormForge’s patented bi-dimensional autoscaling solves this by treating requests and HPA targets as a coupled pair. It adjusts CPU and memory requests and simultaneously recalculates HPA target utilization as a single atomic change. It preserves the scaling behavior teams intentionally designed rather than altering it as a side effect of vertical adjustments.
Last thoughts
Kubernetes resource optimization is an ongoing and essential task, yet when clusters grow rapidly, the scale of the problem quickly outpaces the team’s capacity to manage it manually.
The practices covered here address the structural reasons why manual optimization breaks down in production. Tools like VPA lower the barrier to getting started. In contrast, ML-based platforms extend the same approach and apply continuous optimization to environments where workload diversity and scale make manual changes impractical and periodic analysis insufficient.
Teams applying continuous resource optimization have closed the automation trust gap by building systems that earned trust progressively. They start with visibility, advance through automation with guardrails, and eventually reach delegation.
Such teams maximize the value of their dynamic and adaptive Kubernetes platforms while concentrating on high-value, proactive platform engineering tasks.