How to Use StormForge Optimize Live’s Node Utilization Reporting
Optimizing pod-level resources is critical in Kubernetes—but without visibility into how those optimizations impact node and cluster-level efficiency, the story is incomplete.
StormForge Optimize Live has long focused on rightsizing workloads at the pod level, helping teams reduce overprovisioning and improve application reliability. But seeing the impact of those changes at the node layer often required digging into Application Performance Monitoring (APM) tools—if the relevant data was even available.
With the launch of node utilization reporting, StormForge makes it easy to observe how pod rightsizing improves overall cluster efficiency. You can now track resource allocation versus actual usage across nodes, helping you surface new opportunities for cost savings and optimization.
Getting Started with Node Utilization Reporting
To use this feature, make sure you’re running StormForge Agent version 2.21.2 or later. Once installed, the agent will begin collecting data from your cluster in just a few minutes.
From there, you’ll be able to:
- View utilization trends across all clusters
- Slice the data by cluster, node type, and more
- Compare usage to requests and total node capacity
What You’ll See in the Report
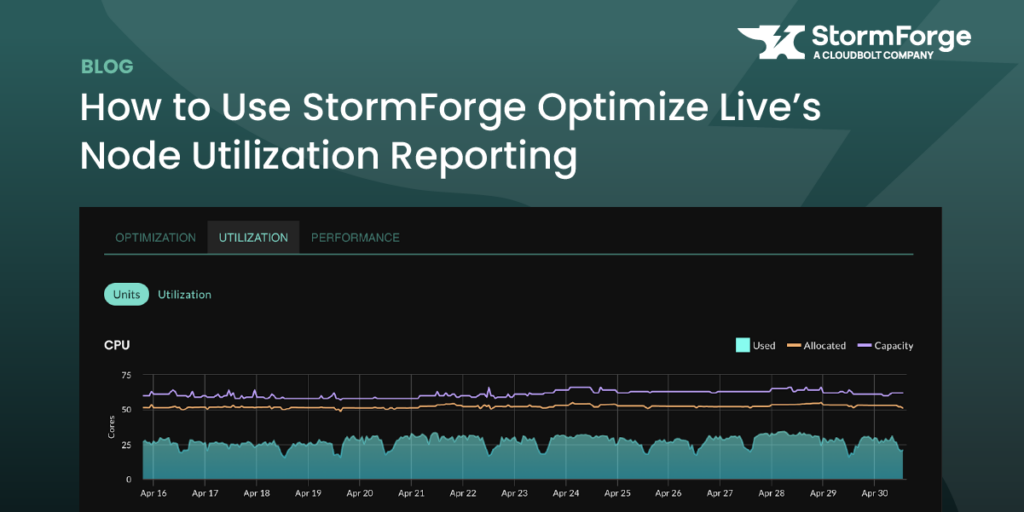
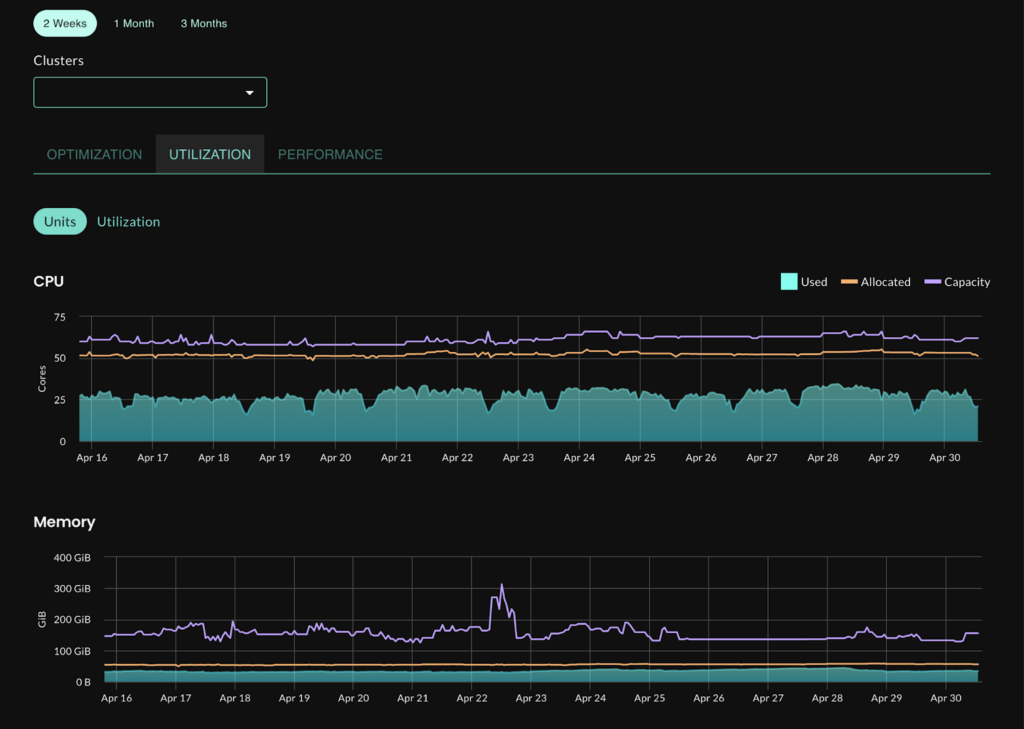
CPU and Memory Utilization vs Allocation
Quickly compare actual usage against pod requests and total node capacity. For example, if you’re seeing 10% average CPU utilization, you likely have significant room for optimization.
Identifying Overprovisioned Node Types
This view helps you identify whether you’re using more specialized nodes than needed. If memory requests are consistently low, you may be able to switch from memory-optimized nodes to general purpose instances, reducing cloud spend without sacrificing performance.
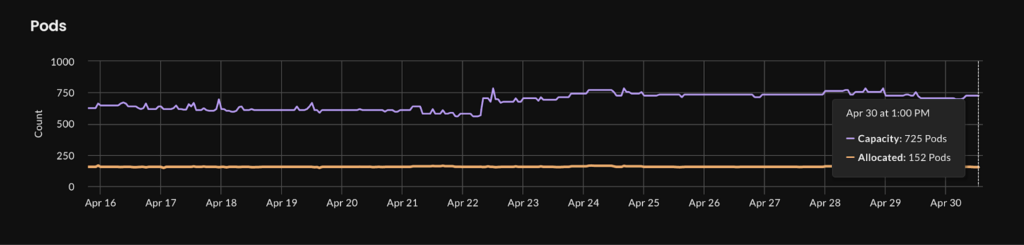
Pod Density and Bin-Packing Insights
The pods per node graph highlights whether you’re maxing out pod count before fully utilizing CPU or memory. This is a common issue caused by default limits like maxPods.
You can:
- Adjust node settings (e.g. maxPods in the kubelet, or enable prefix delegation in EKS)
- Tune HPA settings to reduce replica counts when appropriate
- Favor fewer, larger replicas where your availability model allows
Node Type Distribution
This view shows a breakdown of the node instance types running in your cluster.
If you use Cluster Autoscaler, you’ll likely see a stable, limited node pool. If you use Karpenter, you’ll notice more dynamic changes in node types as workload demands fluctuate.

Wrapping Up
Previously, it was difficult to see how pod rightsizing holistically improved your cluster. With the new node utilization reporting feature in StormForge Optimize Live, you can now visualize cluster-wide impact, uncover new optimization opportunities, and take better control of your Kubernetes spend.
Ready to give it a try? Start a free trial, or explore the feature in our interactive sandbox environment.

Related Blogs
When Karpenter isn’t enough: a real Kubernetes cost teardown
A high-volume payments platform runs hundreds of Kubernetes clusters and thousands of services, with a platform team responsible for the…