What actually happens when a workload OOMs in production
The pager goes off at 2:47 AM. CrashLoopBackOff on a payment service. The on-call rolls over, opens a laptop, runs kubectl describe pod, and sees the line they were already expecting: OOMKilled, exit code 137. The container went over its memory limit. The kernel killed it. It came back, ate too much memory again, and got killed again. The loop is what tripped the alert.
What happens in the next ten minutes is roughly the same in every org I’ve talked to.
The on-call bumps the limit. 2Gi to 4Gi. 4Gi to 8Gi if they’re feeling cautious. They apply the change, watch the pod stabilize, post two lines in the incident channel, and go back to bed.
In the morning, someone asks what happened. The note reads “OOMKilled on payments-api, raised limit to 4Gi, monitoring.” A couple of thumbs-up emojis. The thread closes.
Nobody asks why the workload wanted that much memory in the first place. Nobody pulls a heap profile. Nobody asks whether the limit was wrong from the start, or whether something leaked in last Tuesday’s release.
The fix that actually addresses the underlying problem doesn’t get filed, doesn’t get owned, and doesn’t get touched.
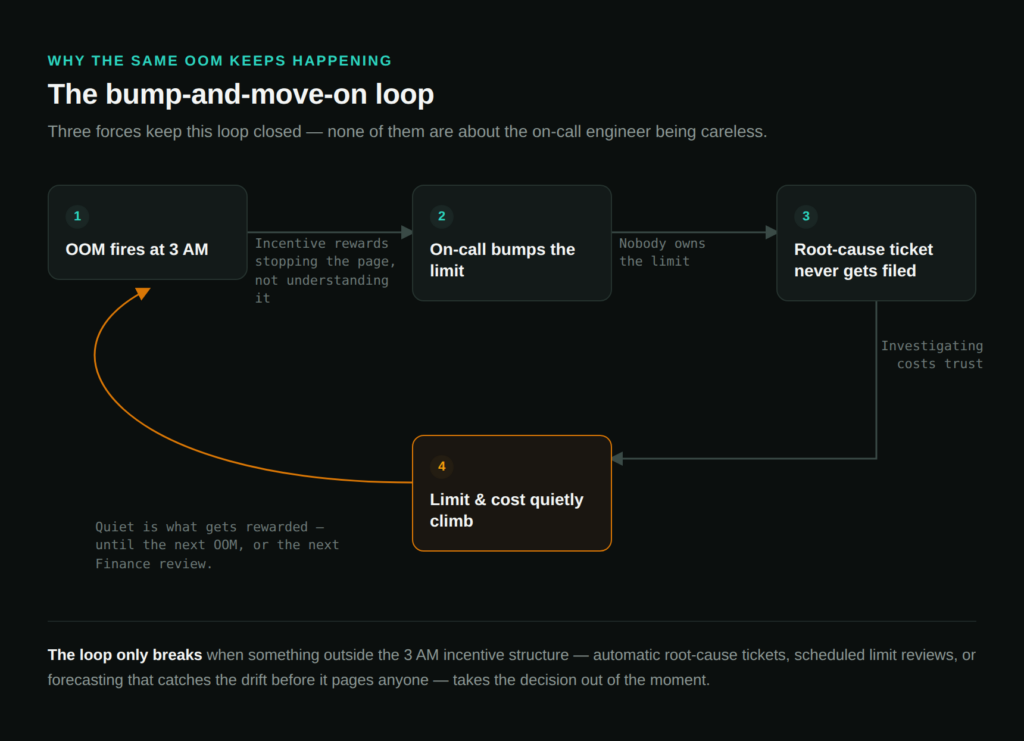
I’ve watched this happen time and time again. It’s not a story about lazy on-call engineers. It’s a story about incentives.
Three things shape the response
- The incentive at 3 AM is to stop the page, not to understand it. On-call rotations are scored on time-to-resolution and on whether the alert came back. Nobody gets credit for finding the root cause at 3 AM. They get credit for going back to bed and not paging the secondary. Bumping the limit is the cheapest action that satisfies both metrics.
- Nobody owns the limit. Application teams set memory limits when they first deploy and never look at them again. Platform teams own the cluster, the schedulers, and the autoscaling tools. They don’t own the resource math on any individual workload. So the engineer who got paged is, almost by definition, not the person who can answer “is 2Gi the right limit for this thing?” They’re operating on a workload that belongs to a team they don’t sit with, on a service whose memory profile they don’t know.
- Investigating costs trust. The fix that addresses the actual problem, a leaky dependency, an unbounded query, and a cache without a TTL, is owned by the application team. The on-call would need to file a ticket against another team’s backlog, hope it gets prioritized over feature work, and explain to their own manager why the same thing might page them again next week. The cheapest path is to bump the limit, document the change, and move on. Even when the on-call knows it’s not really a fix, the math doesn’t reward doing more.
What this looks like in aggregate
Reality is, the limit gets bumped almost every time. I’ve talked to platform teams that have watched their cluster’s memory headroom walk upward across releases for two years. Limits set conservatively eighteen months ago are now 3-4x their original size, and nobody made a deliberate decision to overprovision anything. The numbers in the YAML are the residue of incident response, not capacity planning.
The bill follows. Requests feed scheduling, and most teams set memory requests equal to memory limits because memory is non-compressible. So when the limit gets bumped, the request usually goes with it. Larger requests mean a larger node footprint, fewer pods per node, and more nodes overall. Finance eventually asks why infrastructure spend is up materially year-over-year on flat traffic. The platform team can’t point to a deliberate decision. They can only point to a year of incidents, each of which had a reasonable response in isolation.
And the underlying problems are still there. A 4Gi limit on a service with a slow leak just means it OOMs less often. A bumped limit on a workload with unbounded query results just means the next bad query takes longer to surface.
The bump trades visibility for quiet, and quiet is what gets rewarded.
Why Kubernetes makes this hard
There’s a structural reason the pattern persists. Kubernetes doesn’t make it easy to tell whether a limit is reasonable. The OOM event shows that the workload exceeded its limit. It doesn’t tell you whether the limit was set badly, whether the working set is genuinely growing, or whether a regression in a recent deploy doubled memory use overnight.
To answer those questions, you need historical resource data at usable percentiles, you need OOMKilled events correlated with deploy events, and you need to know what “normal” looks like for that workload across hours, days, and weeks. Most teams don’t have that wired up at the moment of paging. The on-call gets a single data point and a deadline. Of course, they bump the limit.
What better looks like
The on-call should be able to tell, at the moment of paging, whether this workload’s memory usage has been trending upward over weeks or whether it spiked tonight. That’s the difference between “the limit was always too tight” and “something changed in the last release.” Those two cases want completely different responses, and the on-call rarely has the data to distinguish them in the moment. Fixing that means three things:
- OOMKilled events should generate an automatic ticket against the application team’s backlog, with the relevant percentile data and deploy correlation attached. Not a Slack thumbs-up. The team that owns the workload should be the team that sees the signal, not the team that happened to get paged.
- Limits should be reviewed on some cadence, even if it’s quarterly. Not set once at deploy and inherited forever.
- Full automation is the bigger leap. Removing the human from the scramble entirely. The same data that would let an on-call tell a leak from a tight limit can be turned into automated decisions. Detect the OOM event in real time. Look at the workload’s memory pattern over the previous weeks. Bump the request and limit if the working set has been climbing, or route an alert to the application team if the curve changes suddenly. Pair that with proactive forecasting that flags workloads heading toward OOM before they get there, and the 3 AM page becomes the exception, not the default.
None of this is about blaming on-call engineers. The on-call did the right thing for the situation they were handed. The system around them is what makes a thoughtful response expensive and a quick one cheap.
A note on what we built
This is most of why we built StormForge the way we did. The reactive half catches OOM events as they happen and adjusts the memory request and limit automatically, so the on-call doesn’t get paged for the same workload again next week. The proactive half is the more interesting one. StormForge watches each workload’s memory pattern over weeks of usage and forecasts the right request and limit before the workload OOMs. Most of the OOMs I look at with customers were predictable from the usage shape weeks earlier. The bumped-limit dance happens because nothing was watching for the pattern. Now something is.
The point isn’t that platform teams are doing it wrong. The point is that the underlying problem rarely gets touched because the incentives at 3 AM don’t reward touching it.
Bumping the limit isn’t the fix.
Read the fix




Related Blogs
The Technical Guide to Kubernetes Rightsizing from LearnKube
The Technical Guide to Kubernetes Rightsizing from LearnKube is a comprehensive, hands-on guide to safely optimizing CPU and memory across…