When Karpenter isn’t enough: a real Kubernetes cost teardown
A high-volume payments platform runs hundreds of Kubernetes clusters and thousands of services, with a platform team responsible for the runtime that every application engineer builds on top of. When an executive-level cost-reduction initiative put Kubernetes spend under a microscope, the mandate landed squarely on that team. And it came with a constraint that made the easy answers unavailable: cut spend without breaking the developer experience.
By the time they came to StormForge, they had already made real progress at the infrastructure layer. Karpenter was running across the estate, packing nodes efficiently, and costs had come down. What remained was a problem Karpenter was never designed to solve.
In many places, pods were over-requesting CPU by 4–8x. And Karpenter packs nodes to the requests it is handed, so if the requests are wrong, the bin-packing is wrong, no matter how well the scheduler does its job. The waste was sitting upstream of where Karpenter operates.
So they went after the pod layer.
VPA went in first, and it lasted about as long as it took to notice the conflict. If a workload has an HPA scaling on CPU utilization, VPA can’t safely adjust CPU requests, because the two controllers end up fighting over every pod under HPA control. So they hit that wall, pulled VPA, and moved on.
KRR came next, and the recommendations themselves were reasonable. The problem was applying them. KRR tells you what the requests should be. It just doesn’t help you change them safely at scale: no rollback, no automation, no awareness of what the HPA will do when the request shifts underneath it. Across hundreds of clusters, none of that was something the team could manage by hand. The analysis existed; a path to act on it at scale didn’t.
The estate
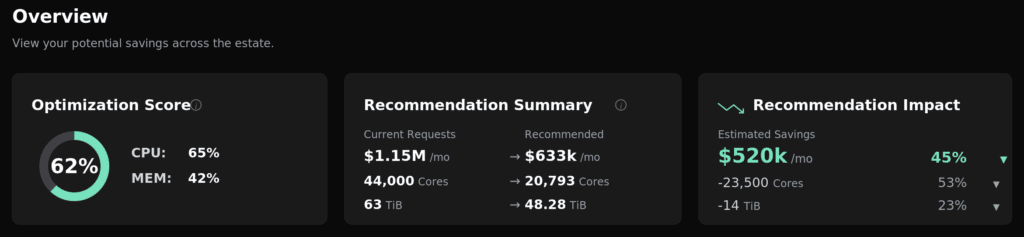
After StormForge ran across the estate:
- CPU: ~44,000 cores → 20,793. ~23,500 cut. 53%.
- Memory: ~63 TiB → 48.28 TiB. ~14 TiB cut. 23%.
- Cost: ~$1.15M/mo → $633k/mo. ~$520k/mo saved. 45%.
Curious how your own cluster compares? Benchmark your utilization →
The headline number gets more interesting up close. Take a slice of the same tenant, a cluster where the workloads haven’t been rightsized yet, and the picture is more complicated than “everything went down.”

Two panels worth reading together: Waste and Performance Risk.
Waste: -2,455 cores, -3.25 TiB, -$66,987/mo. Over-requesting workloads.
Performance Risk: +473 cores, +1,015.86 GiB, +$14,077/mo. The recommender is raising requests on a subset of workloads.
This is the constraint playing out in the data. Those workloads were already consuming that headroom under load, or running close enough to their limits that an OOM was only a matter of time.
Cutting them would have saved money and created incidents in the same move.
So the additional request isn’t new spend; it’s surfacing real consumption that had been quietly covered by risk rather than budget.
The net on this slice is still firmly positive, but notice what the recommender is doing: it isn’t cutting everything it could cut. It’s accounting for what happens when the workload actually runs.
This is also why platform engineers are right to be skeptical of rightsizing tools that don’t make this distinction. The resistance to rightsizing recommendations almost always traces back to a previous incident: something got cut too thin, something broke, someone got paged at 3 a.m. A recommender that raises requests on underprovisioned workloads is a fundamentally different conversation than one that claims to find savings everywhere without ever distinguishing where the headroom is real.
One workload makes this concrete. A notification-worker Deployment in this estate, sized at 14 cores and 29 GiB, came back with an optimization score of 71%, and the recommendation raised every dimension: cores 14 → 17 (+23%), memory 29 GiB → 61 GiB (+106%), cost $416/mo → $586/mo (+$170/mo, +41%). Memory more than doubled. That’s the recommender saying the workload was running close enough to its memory limit that an OOM was a matter of time, and that it’s better to add the request now than absorb the page later.
Zooming in: payments-api
Before: $1,851/mo. Efficiency score: 22%. CPU utilization: 3%. Memory utilization: 51%.
apiVersion: apps/v1
kind: Deployment
metadata:
  name: payments-api
spec:
  template:
    spec:
      containers:
      - name: app
        resources:
          requests:
            cpu: "8000m"
            memory: "40Gi"
          limits:
            cpu: "16000m"
            memory: "40Gi"
---
apiVersion: autoscaling/v2
kind: HorizontalPodAutoscaler
spec:
  metrics:
  - type: Resource
    resource:
      name: cpu
      target:
        type: Utilization
        averageUtilization: 65
| Parameter | Before | After |
| CPU request | 8000m | 216m |
| Memory request | 40Gi | 20.58Gi |
| HPA target | 65% | 90% |
The CPU story
The CPU request is 8 cores; actual sustained usage is a fraction of one. That gap is pure waste, multiplied across every replica, and it has a second-order effect on scaling. The HPA scales on CPU utilization, the ratio of actual usage to requested CPU, so with an 8-core request and near-zero usage, utilization sits at 3%, far below the 65% target. The HPA almost never fires. The workload just runs at minReplicas continuously, each pod reserving 8 cores it never touches. The team is paying around the clock for HPA-managed capacity that never gets used.
The memory story
Memory tells a different story. Request and limit are both pinned at 40Gi, and when request equals limit, the pod runs in Guaranteed QoS: the scheduler reserves the full 40Gi and leaves the pod zero burst headroom. So any spike above 40Gi isn’t throttled or queued. It’s an immediate OOM kill.
After: $412/mo. 78% reduction. -46.7 cores, -116.5 GiB.
spec:
  template:
    spec:
      containers:
      - name: app
        resources:
          requests:
            cpu: "216m"
            memory: "20.58Gi"
          limits:
            cpu: "648m"
            memory: "61.73Gi"
---
spec:
  metrics:
  - type: Resource
    resource:
      name: cpu
      target:
        type: Utilization
        averageUtilization: 90
CPU request: 8000m → 216m, with the limit dropping 16000m → 648m, roughly a 97% cut on the request while preserving 3x burst capacity. Memory request: 40Gi → 20.58Gi, limit 40Gi → 61.73Gi. Because request and limit are no longer equal, the pod moves out of Guaranteed QoS and finally has headroom to absorb spikes. And the HPA target shifts 65% → 90%, so with an accurate CPU request, pods are allowed to run hotter before the HPA decides to add replicas.
All three changed together. That’s the mechanism that made it work.
The coupling problem
VPA and KRR both identify oversized requests. That part neither gets wrong. What neither one does is reason about request, limit, and HPA target as a single connected system.
Change a CPU request on a workload with an HPA and you’ve changed the workload’s scaling profile: when it fires, and how aggressively. Cut the request without adjusting the HPA target, and you can land in constant scale-out on a workload that doesn’t need it. That’s exactly why teams are right to be cautious about applying rightsizing recommendations without something that understands the relationship between all three parameters at once.
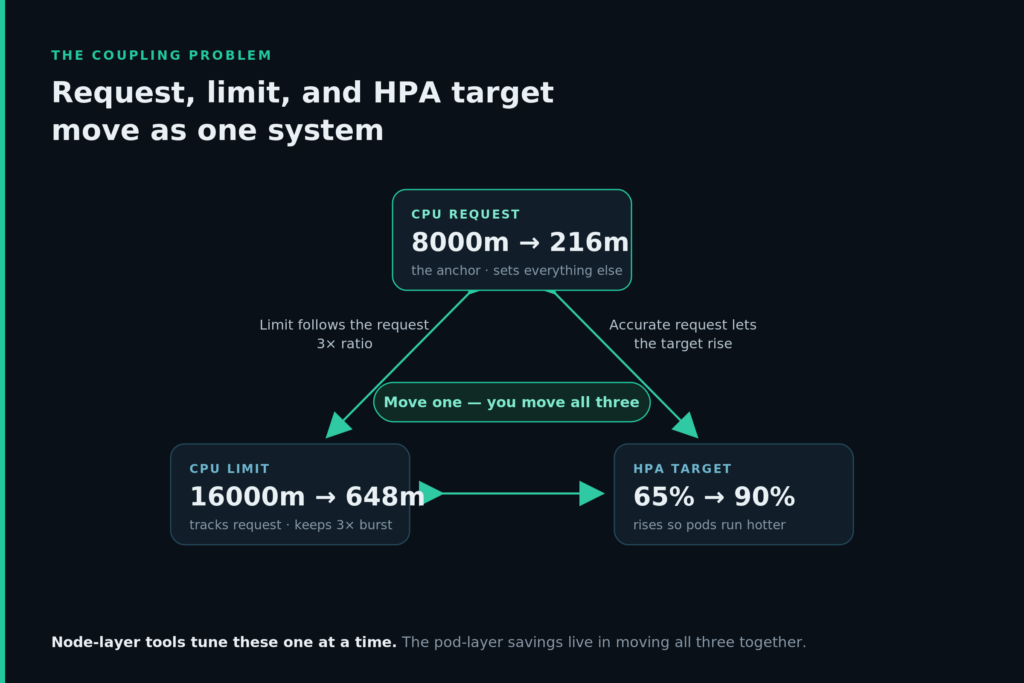
In this case, the optimization policy (RequestsRaiseLimitsIfNeeded) raised the memory limit when the new request multiplied by the workload’s limit-to-request ratio (3.0) exceeded the old limit. The 90% HPA target reflects the cluster-default ceiling configured on hpa.cpu.target-utilization.max. Neither value required a human to step in.
None of this went straight to auto-deploy. The agent went into non-prod first, all of it, all 65 non-prod clusters, before a single prod cluster was pulled in. Then production came in waves: the applier ran read-only at first, and when the team did start applying, it started as a pilot, with auto-deploy enabled in the observability namespace before expanding to selected internal teams across most (though not all) prod clusters. The pattern was deliberate. Each layer had to prove itself before the next one turned on.
The 78% on payments-api isn’t representative across the estate, and it’s worth being honest about that. Some workloads moved more, some barely moved, and several ended up with more memory than they started with.
What held consistently was the part that matters: HPAs didn’t oscillate, pods didn’t OOM, and Karpenter consolidated underneath on its own, because aggregate requests finally dropped to reflect actual consumption. For platform teams operating at this scale, that’s where the pod-layer savings actually live: in the coupling between requests, limits, and HPA targets that node-layer tooling simply can’t reach.
See what’s hiding in your pod requests
Start a free trial




Related Blogs
The full CloudBolt CMP, now free for up to 100 resources
CloudBolt CMP is a powerful platform, and I would know, I’ve spent the last decade building it. Getting it into…