OOMKilled, short for out-of-memory killed, is one of the most common container failure modes in Kubernetes, and also one of the most misdiagnosed. The name points to memory, but the exit code points to Linux kernel behavior, and the fix usually involves more than raising a Kubernetes resource limit.
The failure splits into three distinct problems, each needing a different fix:
- Limit set below peak demand.
- Memory leak that grows across container lifetimes.
- A traffic spike that pushes the in-memory state beyond the steady-state profile used to set the limit.
Treating all three the same way fixes the symptom but leaves the cause in place.
When a Kubernetes OOMKilled occurs in production, the platform engineer must resolve the incident, even though someone else may have set the memory limit or built and deployed the application. That accountability gap is what makes diagnostic precision matter.
This article covers how to identify the root cause of the error and how to resolve it.
Summary of key Kubernetes OOMKilled concepts
| Concept | Description |
|---|---|
| How the Linux OOM killer terminates containers | When a container’s memory usage reaches its cgroup limit, the Linux kernel’s OOM killer terminates the process with SIGKILL and produces exit code 137. Kubernetes records this as OOMKilled in the container status. |
| Root causes of OOMKilled failures |
Each needs a different remediation, so identifying the underlying cause comes before any fix. |
| Diagnosing OOMKilled with kubectl |
|
| Distinguishing OOMKilled from other crash causes | Exit code 137 indicates SIGKILL, but liveness probe failures and node evictions also restart pods without OOMKilling them.Cross-referencing exit codes with pod events and node conditions isolates OOM as the cause. |
| The limit-setting tradeoff |
|
| ML-based memory limit optimization | Reanalyzing every workload manually after each OOMKill does not scale. Models trained on usage history identify the p99 or p999 threshold that separates normal spikes from leaks, enabling automated limit management that keeps pace with workload changes. |


Automated vertical autoscaling designed to scale for 100K+ containers

Fully compatible with HPA functionality and cloud-based services

Powered by advanced machine learning with user-controlled guardrails
How the Linux OOM killer terminates containers
Kubernetes memory limits are not enforced by the control plane. The Linux kernel enforces them through cgroups. When you set resources.limits.memory on a container, Kubernetes writes that value to memory.max in the container’s cgroup (memory.limit_in_bytes on older cgroup v1 systems). From there, the kernel tracks allocation against that boundary, and once the process crosses it, the kernel’s cgroup OOM killer fires. The kill occurs regardless of the node’s free memory, unlike the system-wide OOM killer, which responds to memory exhaustion across the entire node.
The OOM killer sends SIGKILL directly. There is no SIGTERM, no graceful shutdown, no application cleanup. The exit code is 128 + 9 = 137 and is recorded in lastState.terminated.exitCode.
The abruptness is why OOMKilled events leave databases with uncommitted transactions or queues with in-flight messages. The process had no chance to flush the state.
One behavior masks the root cause more than any other. After an OOMKilled termination, the kubelet restarts the container according to its restartPolicy. What operators see in dashboards is a rising RESTARTS count, not an obvious memory signal.
kubectl get pods -n production
NAME                       READY   STATUS    RESTARTS   AGE
api-server-7d9f4b-xk2np    1/1     Running   4          2h
Four restarts with a Running status read like a transient hiccup. The cause only appears under describe:
kubectl describe pod api-server-7d9f4b-xk2np -n production
Last State:  Terminated
  Reason:    OOMKilled
  Exit Code: 137
Key insight: OOMKilled pods often show Running in kubectl get pods because Kubernetes restarts them immediately. The restart count is the only signal in standard output. The real cause lives in lastState.terminated.
| Solution | Rightsizing recommendations | Automation | Fully compatible with HPA | Powered by machine learning | Historical metrics analysis | Trend forecasting |
|---|---|---|---|---|---|---|
| VPA |  |
|
 |
|
|
|
| StormForge | |
|
|
|
|
|
Root causes of OOMKilled failures
The same OOMKilled event can have three causes,
Limit set below peak usage
A container sized against average usage or a staging environment has no headroom for production spikes, large payloads, or cache growth. The events coincide with high-traffic periods and often occur after months of stable operation, once traffic exceeds the profile used to set the limit.
Memory leak
Memory climbs steadily across the container’s lifetime rather than spiking at events. Each restart resets the counter, then the trend resumes. Charting usage across multiple lifetimes makes it visible.
container_memory_working_set_bytes{pod=~"api-server-.*", container="api-server"}A leak shows a ceiling that rises across restarts. A bad limit shows a flat baseline that jumps to the limit at specific events.
Traffic-driven spike
JVM heap expansion, request buffering, and large dataset loads push usage past the steady state without a persistent leak. These events track specific operations rather than container age, and a targeted p99 limit increase usually resolves them.
Key insight: Checking the termination reason without charting memory over time leads to the wrong remedy, usually a limit increase that delays the next failure instead of preventing it.
Diagnosing OOMKilled with kubectl
The diagnostic chain starts with confirming the failure type, then locating the memory timeline.
Step 1: Confirm OOMKilled as the cause.
kubectl describe pod <pod-name> -n <namespace>
Last State:  Terminated
  Reason:    OOMKilled
  Exit Code: 137
  Finished:  Tue, 14 May 2026 14:22:43 +0000
Reason: OOMKilled and exit code 137 together confirm kernel OOM termination. Note the Finished timestamp, which you need to correlate metrics.
Step 2: Correlate memory usage with that timestamp.
container_memory_working_set_bytes{namespace="production", pod=~"api-server-.*"}
/ container_spec_memory_limit_bytes{namespace="production", pod=~"api-server-.*"}
This ratio shows usage as a fraction of the configured limit. A value approaching 1.0 just before Finished confirms the container ran out of headroom. A jump from 0.4 to 1.0 in under a minute points to a spike. A climb from 0.5 to 1.0 over hours points to a leak.
Here is an example of how that could look in the pod description:
kubectl describe pod api-server-7d9f4b-xk2np -n production

Containers:
  api-server:
    State:          Running
      Started:      Thu, 14 May 2026 14:22:51 +0000
    Last State:     Terminated
      Reason:       OOMKilled
      Exit Code:    137
      Started:      Thu, 14 May 2026 13:41:07 +0000
      Finished:     Thu, 14 May 2026 14:22:43 +0000
    Restart Count:  4
    Limits:
      memory:  512Mi
    Requests:
      memory:  256Mi
QoS Class:          Burstable
Events:
  Type     Reason   Age                Message
  Warning  BackOff  42m (x3 over 81m)  Back-off restarting failed container api-server
Key insight: The Finished timestamp and the Prometheus memory timeline are the two data points that separate a bad limit from a leak and should be considered together to determine the root cause..
Distinguishing OOMKilled from other crash causes
Exit code 137 is not exclusive to OOM termination, and pod restarts have several sources. Confirming memory as the cause before changing limits avoids the wrong fix.
Node eviction is not OOMKilled
Under node-level memory pressure, the kubelet evicts pods by QoS class (BestEffort first, then Burstable, then Guaranteed) before individual containers hit their cgroup limits. This is a separate diagnostic path from a container-level OOM kill, and it is worth checking first when several pods fail together. An evicted pod shows Evicted status, and the node shows a MemoryPressure condition:
kubectl describe node <node-name> | grep -A1 "MemoryPressure"
  MemoryPressure   True   NodeHasInsufficientMemory
A namespace-wide check tells you whether one container is misconfigured or the whole node is under pressure:
kubectl get events -n production --field-selector reason=OOMKilling --sort-by='.lastTimestamp'Multiple pods OOMKilling together points to node pressure. A single repeat offender points to one bad limit. A container can still be OOMKilled on a node with free memory when its own cgroup limit is set too low.
Liveness probe failures cannot be separated by exit code alone
A failed probe causes the kubelet to send SIGTERM, followed by SIGKILL after the grace period. The exit code depends on how the application handles SIGTERM: 143 if it exits on the signal, 137 if it ignores it, or an application-specific code if it traps the signal and exits on its own. The reliable differentiator is the Killing event that cites the failed probe in kubectl describe, not the exit code.
A JVM OutOfMemoryError is not kernel OOM killing
Java applications throw OutOfMemoryError when the heap is exhausted and exit with code 1. The fix is tuning -Xmx relative to the container limit, not raising the limit itself.
| Failure type | Exit code | kubectl status | Fix |
|---|---|---|---|
| Kernel OOM kill | 137 | OOMKilled | Rightsize memory limit |
| Node eviction | Any / none | Evicted | Check node capacity or QoS class |
| Liveness probe timeout | 143 or 137, depending on SIGTERM handling | CrashLoopBackOff | Adjust probe timing |
| JVM OutOfMemoryError | 1 | CrashLoopBackOff | Tune -Xmx relative to limit |
Key insight: Exit code 137 with Reason: OOMKilled is the only failure in this table that a memory limit change will fix.
The limit-setting tradeoff
In practice, containers tend to fall into two camps: a subset that are under-provisioned and regularly hit memory limits, and a larger group that are over-provisioned as teams add headroom after each incident.
Asymmetry arises from an incident-by-incident response rather than systematic rightsizing, and it is where the cycle of OOMKilled events and arbitrary limit inflation begins.
The analytical alternative is percentile-based limits. Setting limits at p99 of historical peak usage covers most spikes without large idle buffers. Setting them at p999 adds margin for rare but legitimate allocations, such as monthly batch runs. The decision requires usage data from a representative traffic window.
The most underexplained risk is the cascade that comes from requests set far below limits. The scheduler uses requests, not limits, to decide which nodes have room.
Set requests at 256Mi and limits at 2Gi, and the scheduler places pods as if each needs 256Mi. It can pack far more pods onto a node than can coexist when all of them reach peak memory at once.
The next snippet shows MemoryPressure: True alongside multiple pod eviction events. Such an example helps distinguish node-level pressure from a single container OOMKill.
kubectl describe node <node-name> | grep -A5 "MemoryPressure\|Evict"
Conditions:
  Type             Status  LastHeartbeatTime                 LastTransitionTime                Reason                       Message
  ----             ------  -----------------                 ------------------                ------                       -------
  MemoryPressure   True    Thu, 17 Jul 2026 14:52:01 +0000   Thu, 17 Jul 2026 14:48:33 +0000   KubeletHasInsufficientMemory   node has insufficient memory available
  DiskPressure     False   Thu, 17 Jul 2026 14:52:01 +0000   Thu, 17 Jul 2026 09:10:14 +0000   KubeletHasNoDiskPressure       node has no disk pressure
  PIDPressure      False   Thu, 17 Jul 2026 14:52:01 +0000   Thu, 17 Jul 2026 09:10:14 +0000   KubeletHasSufficientPID        node has sufficient PID available
  Ready            False   Thu, 17 Jul 2026 14:52:01 +0000   Thu, 17 Jul 2026 14:48:33 +0000   KubeletNotReady                PLEG is not healthy

Events:
  Type     Reason                 Age    From               Message
  ----     ------                 ----   ----               -------
  Warning  EvictionThresholdMet   4m     kubelet            Attempting to reclaim memory
  Warning  Evicting               3m52s  kubelet            Evicting pod default/api-server-7d9f6b8c4-xk2pq: The node was low on resource: memory. Threshold quantity: 100Mi, available: 62Mi.
  Warning  Evicting               3m48s  kubelet            Evicting pod default/worker-deployment-5c8b9d6f7-rnv4t: The node was low on resource: memory. Threshold quantity: 100Mi, available: 41Mi.
  Warning  Evicting               3m45s  kubelet            Evicting pod monitoring/prometheus-6f7d8c9b5-wq3lm: The node was low on resource: memory. Threshold quantity: 100Mi, available: 28Mi.
  Normal   NodeNotReady           3m40s  node-controller    Node ip-10-0-1-42 status is now: NodeNotReady
Kubectl describe node output showing the MemoryPressure condition and recent eviction events tied to multiple pods
Key insight: Limits set far above requests create implicit overcommitment. The scheduler sees headroom that does not exist, and when several Burstable pods claim it at once, evictions cascade across workloads that never exceeded their own limits.
ML-based memory limit optimization
Setting accurate limits manually is not scalable, and without continuous analysis, limits drift away from real demand. The cycle of crashes, arbitrary increases, and wasted capacity can be addressed by using a tooling tier, as shown below.
VPA
The Kubernetes Vertical Pod Autoscaler reviews historical usage and generates updated recommendations for requests and limits. With updateMode: Auto, it applies them directly:
kubectl get vpa api-server -n production
NAME         MODE   CPU   MEM    PROVIDED   AGE
api-server   Auto   250m  512Mi  True       14d
For workloads with stable usage, VPA’s default 8-day lookback provides accurate results and eliminates the manual step. However, it is less useful for irregular or periodic workloads. A recommendation built from 8 days of low traffic is too low for the next monthly reporting run.
ML-based rightsizing
StormForge by CloudBolt classifies workloads by behavioral type (stateless services, batch jobs, scheduled pipelines) and models the memory distribution for each independently. Rather than a single window, it captures the usage shape across the full behavioral cycle and recommends per-container limits that reflect the actual peak.
The StormForge trust model matters as much as accuracy. Platform teams rarely accept automated changes to production limits without a staged path. For a workable rollout, CloudBolt offers
- Launch in read-only recommendation mode
- Validation in development and staging namespaces
- Fast correction workflows in production for cases where an OOMKill still occurs after an adjustment.
Limits update continuously as behavior changes, after a deployment, after traffic exceeds a historical peak, or after a dependency update shifts heap allocation, rather than only when an OOMKilled event forces a manual reanalysis.
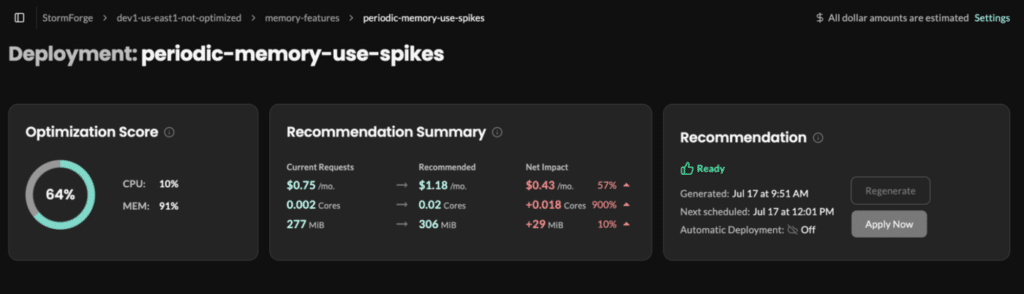
For teams running across multiple clusters, StormForge by CloudBolt ties rightsizing recommendations to cluster-level cost data, so the waste from over-provisioning becomes a number you can prioritize against, rather than chasing whichever service OOMKilled most recently.
Key insight: VPA fits workloads with consistent usage but misses periodic spikes outside its lookback window. Classification by behavioral type captures the full cycle, including the monthly batch run or annual peak that a rolling window never sees.
Recommendations
| Best practice | How to implement | Why |
|---|---|---|
| Confirm OOMKilled before changing anything. | Run kubectl describe pod and verify Reason: OOMKilled with exit code 137 first. | Restart counts look identical irrespective of root cause. |
| Chart memory across lifetimes before adjusting limits. | Plot container_memory_working_set_bytes over several days to separate a bad limit (flat baseline, spike at events) from a leak (rising trend across restarts). | Determines whether to change the limit or file an application bug. |
| Set limits at p99 of the production peak, not average. | The window must cover representative high-traffic events, including nightly or weekly jobs. | Staging profiles almost always produce limits that are too low. |
| Close the requests-to-limits gap deliberately. | For Burstable workloads, keep the ratio below 4x to reduce the risk of cascading when shared-node pods peak together. | Guaranteed QoS (requests equal limits) protects pods from eviction under node pressure. |
Treat limit management as continuous, not post-incident. VPA is a reasonable starting point for teams without a rightsizing tool. For irregular workloads or fleets too large for manual review, ML-based tools like StormForge keep limits accurate as workloads change, removing the OOMKilled event as the trigger for re-analysis.
Conclusion
OOMKilled failures are a symptom of the broader resource specification problem. Limits set without a clear methodology get it wrong in both directions. The diagnostic steps here isolate OOM termination from other causes of crashes and distinguish the three root causes, each with its own remediation. Skipping that distinction and raising the limit is the fastest path to a cluster where most workloads are over-provisioned, and a minority are still crashing.
Addressing the problem systematically breaks the cycle of OOMKilled events and arbitrary limit inflation, thereby reducing the cost of memory management in Kubernetes.
The tooling already exists, from VPA for stable workloads to ML-based rightsizing for complex patterns, and none of it requires a custom analysis pipeline. What it requires is treating limit accuracy as an ongoing operational concern rather than a setting revisited only after the next incident.



Related Blogs

VMware Aria alternative for VCF 9: Aria vs CMP – Part 2
Part 2 of 3. Read Part 1: why companies are making the move | Read Part 3: testing VMware alternatives…