Kubernetes cost visibility is a solved problem for most organizations. The new challenge teams face is acting on resource usage data at such a speed and scale to correct waste in real time and prevent unnecessary spend in the first place.
Kubernetes cost management operates on two tracks: preventing over-provisioning before it happens, and correcting resource waste as it gradually creeps in. How you implement these functionalities determines whether you can smoothly operate fast-changing cluster workloads while keeping costs under control.
This article covers Kubernetes cost management in detail, including concepts for translating cost visibility into controlled spend through resource governance measures, making teams accountable, implementing CI/CD integrations to catch over-provisioning early, and ultimately shifting from periodic cost reviews to continuous optimization workflows.
Summary of key Kubernetes cost management concepts
The table below summarizes six key concepts covered in this article.
| Concept | Description |
|---|---|
| Namespace resource quotas and LimitRanges for Kubernetes cost management | ResourceQuota objects cap total CPU and memory consumption per namespace, while LimitRange objects enforce defaults and per-pod bounds when teams omit resource specs. Together, they prevent individual namespaces from consuming disproportionate cluster capacity without explicit approval. |
| Cost-aware CI/CD integration | Embedding resource request validation into deployment pipelines catches over-provisioned specs before they reach production, where accumulation across hundreds of workloads creates waste much harder to remediate retroactively. |
| Chargeback and showback models | Showback provides cost visibility per team without financial consequence; chargeback allocates the actual budget impact. Both change provisioning behavior, but chargeback creates stronger incentives to rightsize because teams pay directly for unused reservations. |
| Waste detection across workloads and namespaces | Identifying idle deployments, oversized requests, and abandoned namespaces requires combining pod usage metrics with workload activity signals, such as request rates and job completion timestamps, rather than usage averages alone. |
| Continuous optimization vs. periodic reviews | Resource specs that are accurate at deploy time drift over the next few weeks as workloads evolve. Continuous optimization systems monitor usage drift and automatically refresh recommendations, but their real value lies in a trust model that lets teams act on those recommendations safely. |
| Multi-cluster Kubernetes cost governance | Managing spend across EKS, AKS, and GKE requires normalizing cost data across provider billing formats and applying consistent quota and optimization policies without per-cluster manual configuration. |


Automated vertical autoscaling designed to scale for 100K+ containers

Fully compatible with HPA functionality and cloud-based services

Powered by advanced machine learning with user-controlled guardrails
Namespace resource quotas and LimitRanges for Kubernetes cost management
Quotas are the first cost-prevention and resource-restricting mechanism for Kubernetes cluster administrators. They are native, cheap, and effective.
A ResourceQuota caps the total CPU and memory an individual namespace can claim, preventing a single team from consuming a disproportionate or unfair share of overall cluster capacity during, for example, a deployment spike or in a test environment that wasn’t cleaned up.
A LimitRange covers the complementary failure mode: it applies default resource bounds to pods that do not specify their resource requirements. This ensures that when a developer omits resource specs entirely, pods are not unbounded in their resource usage and cannot destabilize their node neighbors.
A minimal example for a team namespace looks like this:
apiVersion: v1
kind: ResourceQuota
metadata:
  name: team-a-quota
  namespace: team-a
spec:
  hard:
    requests.cpu: "40"
    requests.memory: 160Gi
---
apiVersion: v1
kind: LimitRange
metadata:
  name: team-a-defaults
  namespace: team-a
spec:
  limits:
  - type: Container
    defaultRequest:
      cpu: 250m
      memory: 256Mi
    default:
      cpu: "1"
      memory: 1Gi
Example Resource Quota and Limit Range specification (source)
Bear in mind that setting these values across cluster namespaces is an operational judgment call. Quotas set too low can block legitimate deployments during peak periods, and the resulting exception requests erode trust in the mechanism as a whole. A useful rule of thumb is to start with 1.3x to 1.5x the team’s measured peak usage, but this needs to be reviewed regularly against each team’s utilization and growth data.
Be clear about what “regularly” means here, because it trips up a lot of teams. A quarterly quota review, for example, is a minimum floor for teams that have no continuous monitoring in place – it is not a sustainable or recommended steady state, however. As the continuous optimization section below explains, workload usage drifts much faster than a quarterly cycle can keep pace. Treat the quarterly review as the fallback you rely on while you build toward something that continuously monitors utilization.
| Solution | Rightsizing recommendations | Automation | Fully compatible with HPA | Powered by machine learning | Historical metrics analysis | Trend forecasting |
|---|---|---|---|---|---|---|
| VPA |  |
|
 |
|
|
|
| StormForge | |
|
|
|
|
|
Cost-aware CI/CD integration
Wasted or incorrectly sized resources should be caught early, well before production. If you allow resource waste to reach production, you also waste remediation time and effort through unnecessary change tickets, testing, and coordination.
By far the most effective place to fix an oversized resource request is the pull request that introduces it. Three pipeline mechanisms prevent cost and resource waste from accumulating on the route to production:
- Resource spec validation in pull requests
- Budget impact estimates during code reviews
- Enforcement during deployment via admission policies
In pull request pipelines, automated checks can flag request value changes that exceed a per-container threshold or the introduction of manifests without explicit limits before merge.
Similarly, the pull request and code review process can include tooling to compute the projected monthly cost based on a deployment’s new resource values. This surfaces the cost conversation across the entire team during code review rather than in a post-mortem.
Admission controllers intercept requests to the Kubernetes API server before resources are created and can validate or modify the values initially passed to the server. In this way, an admission webhook can be used to reject or modify deployments based on a pod’s resource settings. A validating admission controller can validate pod specs and enforce hard limits by rejecting non-compliant pods. A mutating admission controller can modify pod specs before they are submitted to the API. This allows administrators to develop policies that apply sensible defaults or constrain excessive values. For example, admission controllers can be used to:
- Inject request and limit values when none were provided by the developer
- Enforce minimum and maximum values for requests and limits
- Enforce a maximum ratio between requests and limits
- Independently manage CPU, memory, pods, containers, and init containers
- Apply standards such as requests set to limits for guaranteed QoS for given workload types, e.g., latency-sensitive stable workloads like databases
The policies governing admission controller behavior need to be agreed upon and communicated, because while admission controllers can act as a catch-all cost gate, they can also create friction with development teams, who tend to see them as slowing down their deployments. So, cluster administrators should frame the gate as a constructive tool that catches issues early, rather than as a blocking control. Publishing the threshold logic helps here, too. Ensuring teams buy into this measure improves compliance and reduces the need for circumvention fixes.
Chargeback and showback models
Prevention mechanisms work better when teams have a financial reason to care.
Showback is the first step: publishing per-team cost dashboards, albeit without financial consequences, establishes visibility and a baseline before you introduce real budget pressure.
Chargeback goes further by allocating actual budget impact, and it is the stronger behavioral lever. A team charged for its reserved resources, rather than its actual usage, has a direct incentive to reduce requests. In practice, this produces more accurate resource specs than any mandate a central platform team can impose.
Two implementation details determine whether the model survives contact with reality. First, shared infrastructure needs a defined split methodology. Control planes, monitoring stacks, and ingress controllers must be distributed somehow. Typically, costs are apportioned proportionally to usage, equally per namespace, or tiered by service level and applied consistently across billing cycles. Second, the allocation numbers must be defensible. Teams will challenge a chargeback figure they do not believe, so allocation that ties back to the actual cloud bill, including negotiated rates and discounts rather than list-price estimates, removes the easiest objection.
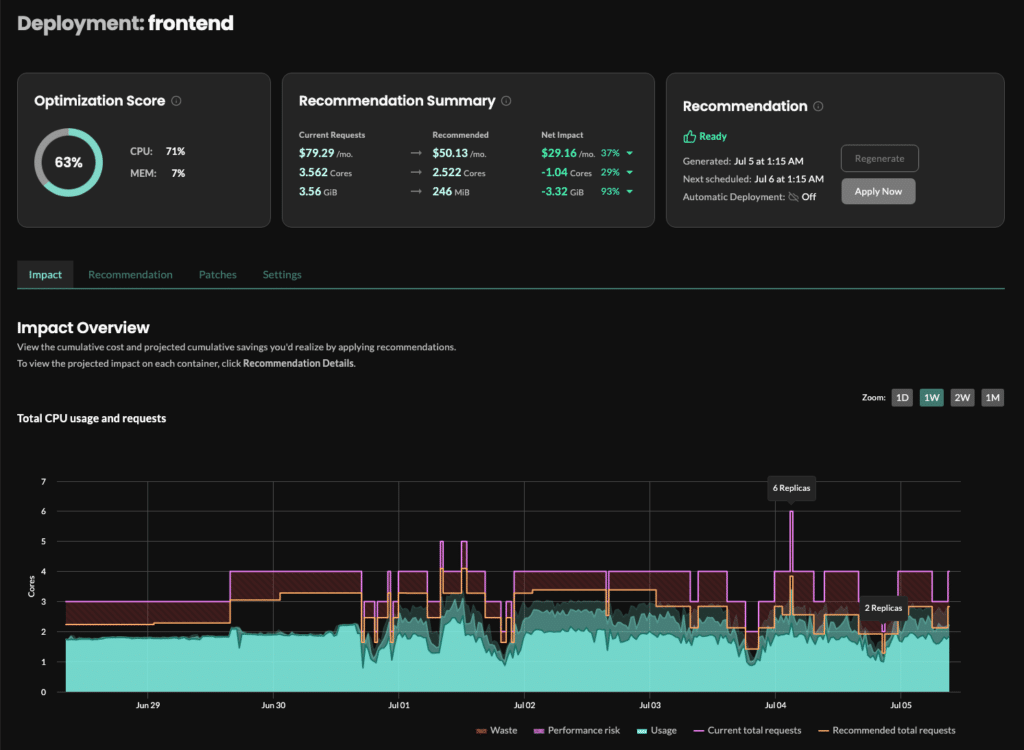
This is an area where platforms like StormForge, which trace Kubernetes cost allocation to the container level and reconcile it with the actual bill, make the accountability conversation considerably less contentious.
Expect organizational friction regardless. Chargeback conversations surface the teams that have been repeatedly over-provisioning, meaning the people who most need to change their behavior are usually the same ones pushing back on the model. That is not a reason to avoid the chargeback process, however. It is a reason to run showback first, openly socialize the methodology, and let teams see their numbers before those numbers carry budget consequences.
Waste detection across workloads and namespaces
To correct existing workloads, the first step is to identify the waste. Three signals cover the majority of wasted resource spending:
- Consistently underutilized requests
- Idle workloads
- Abandoned namespaces
Underutilized requests are typically identified as pods with CPU usage below 20% for more than 7 consecutive days. These are clear indicators of where to start investigating for resource waste. These basic signals are a common starting point, but be mindful of their tendency to yield oversimplified analyses based on short timeframes or naive assumptions.
Idle workloads can be identified by combining namespace CPU metrics with ingress request rates. This will show deployments that hold reserved capacity but receive no traffic, such as staging environments left running after a test cycle.
Abandoned namespaces that exhibit no pod updates, no container restarts, and no ingress traffic for, say, 30 or more days are candidates for decommissioning rather than continued monitoring and cost allocation.
Caution is warranted here, as mentioned, however. Naive automation can often cause incidents because static thresholds create false confidence. Usage averages hide bursty behavior. For example, a workload that shows 15% utilization in aggregate may spike to 300% of its request twice a day when a queue drains or a batch job fires. Apply a simple “under 20% for 7 days” rule to that workload, and you will rightsize it straight into OOM kills and CPU throttling, then spend the next week debugging a failure you created. Avoid using a simple threshold script with too much confidence or automation, as this can prove an expensive combination in platform engineering.
This is why serious waste detection pairs usage metrics with activity signals (request rates, job completion timestamps) and why Kubernetes rightsizing decisions need observation windows long enough to capture peak periods, batch schedules, and traffic seasonality, along with behavioral modeling that distinguishes sustained demand from short bursts. Averages tell you where to look. They are not sufficient evidence to act.
Continuous optimization vs. periodic reviews
The uncomfortable truth about the correction track (versus the prevention approach) is that generating rightsizing recommendations is no longer the hard part. Most teams running a metrics stack can produce reasonable numbers, and most engineers looking at a recommendation can tell it is roughly correct.
Yet those same teams will not let an automated system apply the changes in production. That hesitation, not recommendation quality, is the real barrier. In CloudBolt’s March 2026 survey of 321 enterprise Kubernetes practitioners, 71% said they require human review before trusting automated resource optimization, even while 89% called automation mission-critical.
This hesitation is rational and understandable. Engineers who have been burned by OOMKills from earlier optimization tooling have good reasons to move carefully. But the inevitable math does not accommodate such caution.
Specs that are accurate at deployment time diverge within weeks, not quarters: traffic grows, feature releases shift memory profiles, and dependency updates change consumption patterns. A periodic review effectively analyzes a workload that no longer exists, while manually reviewing every change stops scaling at around 100 workloads. Caution becomes its own failure mode when teams hit this wall.
The answer to this hesitation is not a better recommendation algorithm. It is a trust model. Trust is built from a pattern that works in production through progressive delegation, where success in each step earns the next one:
- Start in read-only mode, where the system only surfaces recommendations
- Validate the recommendations against your own expectations
- Roll out automation progressively from dev to staging to production
- Opt in namespace by namespace rather than cluster-wide
- Treat rollback as the foundation that the whole model rests on
This trust model is where StormForge by CloudBolt fits into the cost management stack. It begins with an advisory-only learning period, collecting workload metrics at 15-second granularity and recommending them without applying them. Teams then choose their rollout model through apply settings: on-demand application, automatic application within configurable guardrails, or export into existing GitOps pipelines.
StormForge optimization settings can also be applied and managed as annotations on namespaces, Deployments, StatefulSets, and other workload resources:
live.stormforge.io/auto-deploy: "Enabled"
live.stormforge.io/learning-period: "P3D"
live.stormforge.io/auto-deploy.thresholds.cpu.unit: "10m"
live.stormforge.io/auto-deploy.thresholds.memory.unit: "64Mi"
live.stormforge.io/auto-deploy.thresholds.cpu.percent: "5"
live.stormforge.io/auto-deploy.thresholds.memory.percent: "20"
live.stormforge.io/apply.method: "PatchImmediateRollout"
live.stormforge.io/apply.max-percent-decrease: "20"
Example: StormForge optimizations settings as annotations (source)
CRD based configuration can also be used where more flexible and granular control is required. Rightsizing changes use in-place pod resizing where supported, rather than the pod evictions that make VPA disruptive, and StomrForge’s patented bi-dimensional autoscaling will update resource requests and HPA target utilization as a single atomic change. Vertical adjustments, therefore, do not destabilize horizontal scaling behavior. Those are precisely the mechanics that allow a cautious team to delegate incrementally rather than choosing between manual review and blind trust.
Multi-cluster Kubernetes cost governance
The practices above are described per cluster, but most organizations run fleets across EKS, AKS, and GKE. These providers, however, do not make cross-cluster comparisons easy. The divergence is a genuine issue for operations, not cosmetic: EKS bills worker nodes as ordinary EC2 line items, with the control plane billed separately at an hourly rate, while GKE Autopilot bills for pod resource requests directly and never shows you a node at all. Comparing per-workload cost across those two models requires translating both into a consistent per-CPU and per-GB view before any comparison is meaningful.
Governance policy has the same consistency problem. Maintaining separate ResourceQuota configurations per cluster guarantees drift, and drift in quota policy quietly becomes drift in spend. Centralized tooling that pushes consistent quota definitions across the fleet, and reports utilization against them in one place, keeps the prevention track intact as the cluster count grows.
Conclusion
Kubernetes cost management is an ongoing operational practice, not a one-time configuration effort. Visibility tools show where the money goes, but they stop there. The prevention track, quota governance, and cost-aware CI/CD change how resources get provisioned in the first place, and chargeback gives teams a reason to keep them honest. The correction track finds the waste that gets through, with the caveat that threshold-based detection alone will eventually rightsize the wrong workload.
What closes the loop is continuous optimization built on a trust model: read-only first, progressive rollout, rollback always available. That continuous feedback loop replaces the structurally insufficient periodic review with a system that stays accurate as workloads evolve, and it finally turns cost data you can see into spend you actually control.


Related Blogs
VMware Aria alternative for VCF 9: Aria vs CMP – Part 2
Part 2 of 3. Read Part 1: why companies are making the move | Read Part 3: testing VMware alternatives…