Java applications are frequently deployed on Kubernetes for their scalability and enterprise features, but this combination introduces unique memory management challenges. Kubernetes adds complexity to Java memory debugging because container memory limits work differently from traditional JVM heap sizing.
While Java’s garbage collection handles memory management automatically, memory issues still occur in containerized environments. Java heap dumps are snapshots of JVM memory at specific points in time, capturing all objects and their relationships within the heap. They are an effective tool for troubleshooting OOMKilled pods, performance degradation, and memory leaks.
When pods get terminated due to memory limits or exhibit poor performance, developers need reliable methods to capture and analyze heap dumps. This article covers multiple collection techniques, analysis approaches, and production best practices for Java developers working with Kubernetes.
Summary Table of key k8s pod Java dump techniques:
| Technique | Description |
| Manual jmap collection | Execute jmap -dump commands inside running pods to generate immediate heap dumps when troubleshooting memory issues. Manual collection requires direct pod access and sufficient disk space. |
| Automated OOM dumps | Configure JVM with -XX:+HeapDumpOnOutOfMemoryError to automatically capture heap dumps when applications crash due to memory limits. |
| kubectl exec workflow | Access running pods with kubectl exec to run diagnostic tools directly. The workflow enables heap dump collection without modifying application code. |
| Storage and transfer strategies | Use persistent volumes for dump storage and kubectl cp for file transfer. These storage strategies help heap dumps survive pod restarts and be accessible for offline analysis. |
| Eclipse MAT analysis | Analyze heap dumps using the Eclipse Memory Analyzer Tool to identify memory leaks, understand object retention patterns, and optimize application memory usage. |
| Production safety practices | Schedule dump collection during low-traffic periods and implement frequency limits to minimize performance impact while maintaining diagnostic capabilities. |
CloudBolt delivers continuous Kubernetes rightsizing at scale—so you eliminate overprovisioning, avoid SLO risks, and keep clusters efficient across environments.
Understanding Java memory in Kubernetes containers
Modern Java versions (Java 10 and later, as well as updated Java 8 builds) automatically detect container memory limits and configure the heap sizes accordingly. With proper JVM configuration using flags like `-XX:MaxRAMPercentage`, applications correctly allocate heap memory within container boundaries, avoiding the memory detection issues that plagued earlier Java deployments in containerized environments.
However, even with correct JVM configuration, Java applications in Kubernetes still experience memory-related failures. Pods get terminated with exit code 137 (OOMKilled) after hours or days of regular operation. Sometimes, the application experiences excessive garbage collection activity, slow response times, and high memory pressure, even without pod termination.
These scenarios often indicate application-level memory issues that proper JVM configuration cannot prevent. Common causes include memory leaks, inefficient object retention patterns, and unbounded caches that accumulate data without eviction policies. Heap dumps provide the diagnostic information needed to identify and resolve these code-level problems.
Example scenario: Memory leak in a properly configured application
A microservice runs with a 2GB container limit and modern Java configured with `-XX:MaxRAMPercentage=75.0`, correctly allocating a 1.5GB heap with 500MB reserved for non-heap memory. The application handles regular traffic successfully for the first 6 hours after deployment. Monitoring shows steady memory growth from 800MB to 1.4GB over this period, followed by an OOMKilled termination.
The heap dump reveals 400MB of HTTP session objects that should have expired after 30 minutes of inactivity. The application’s session timeout configuration was set but never took effect due to a framework configuration error. Each active user session retained 2MB of cached data, and with 200 concurrent users over 6 hours, unexpired sessions accumulated until the heap reached its limit.
Modern container-aware JVM configuration:
java -XX:+UseContainerSupport \
     -XX:MaxRAMPercentage=75.0 \
     -XX:InitialRAMPercentage=50.0 \
     -jar myapp.jar
This configuration correctly limits the heap to 1.5GB (75% of the 2GB container limit) and starts with an initial heap size of 1 GB. The remaining 500MB accommodates the JVM’s non-heap memory, operating system processes, and buffer space. However, this proper configuration doesn’t prevent application code from leaking memory through retained objects, unbounded caches, or framework misconfigurations. Those are types of issues that heap dumps are designed to diagnose.
Note: Container support in legacy Java versions
Legacy Java 8 installations (before 8u191) and configurations with explicitly disabled container support (`-XX:-UseContainerSupport`) can still cause memory allocation issues in Kubernetes environments.
Legacy behaviour example:
A pod with a 2GB memory limit runs on a node with 32GB RAM. Without container-aware settings, the JVM detects 32GB and attempts to allocate an 8GB heap (25% default), immediately triggering an OOMKilled termination. Modern Java versions enable `+UseContainerSupport` by default. Disable container support only when troubleshooting specific compatibility issues with orchestration platforms, as this reintroduces the memory detection problems described above.
Heap dump collection methods
There are several ways to collect and analyze Java dumps on the Kubernetes pods, but they all follow a typical workflow, displayed in the next diagram:
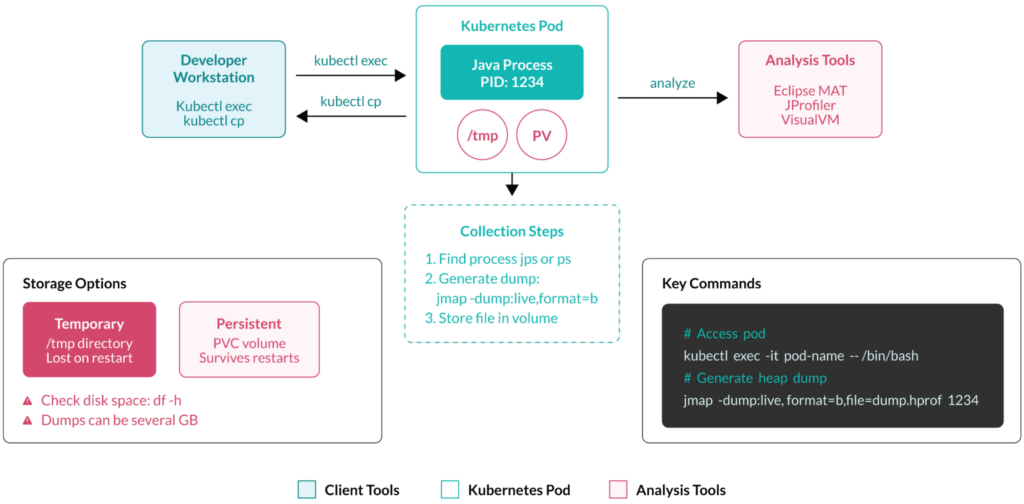
Manual collection with command-line tools
The jmap tool provides the most direct approach for heap dump collection.
jmap tool
Access the pod and identify the Java process before generating dumps.
1. Access the running pod:
kubectl exec -it my-web-app-7d4b9c8f-xk2m9 -- /bin/bash
2. Find the Java process ID.
jps -v
# Output: 1 MyWebApplication -Xmx1024m -jar app.jar
3. Generate the heap dump.
jmap -dump:live,format=b,file=/tmp/heap-$(date +%H%M).hprof 1
The live flag excludes unreachable objects, typically reducing dump size by 30-50%. A 1GB heap usually produces a 400-600MB dump file with this option.
jcmd
jcmd 1 GC.run_finalization
jcmd 1 VM.version
jcmd 1 GC.class_histogram > /tmp/histogram.txt
The jcmd approach provides additional diagnostic information alongside heap dumps. Use GC.class_histogram to quickly identify object counts without generating full dumps – useful for initial memory usage assessment.
Tips
For pods without JDK tools installed, copy utilities from a sidecar container or use base images that include diagnostic tools:
kubectl exec -it debug-sidecar -- cp /usr/bin/jmap /shared-volume/
kubectl exec -it my-web-app-7d4b9c8f-xk2m9 -- /shared-volume/jmap -dump:live,format=b,file=/tmp/heap.hprof 1
Output file size expectations:
- 512MB heap: ~200MB dump file
- 2GB heap: ~800MB dump file
- 8GB heap: ~3GB dump file
Always check available disk space with df—h /tmp before collection to avoid partial dumps caused by insufficient storage.
Automated collection on OutOfMemoryError
Configure JVM flags in your Kubernetes deployment to automatically capture heap dumps when applications crash due to memory issues.
Basic deployment configuration
apiVersion: apps/v1
kind: Deployment
metadata:
  name: java-web-app
spec:
  template:
    spec:
      containers:
      - name: app
        image: mycompany/web-app:1.2.3
        args:
          - "java"
          - "-XX:+HeapDumpOnOutOfMemoryError"
          - "-XX:HeapDumpPath=/heapdumps/"
          - "-XX:+ExitOnOutOfMemoryError"
          - "-jar"
          - "app.jar"
        resources:
          limits:
            memory: "2Gi"
          requests:
            memory: "1.5Gi"
The +ExitOnOutOfMemoryError flag forces the container to terminate immediately after dump generation, triggering Kubernetes restart mechanisms.
Persistent storage for dump retention
spec:
  template:
    spec:
      containers:
      - name: app
        volumeMounts:
        - name: heapdump-storage
          mountPath: /heapdumps
      volumes:
      - name: heapdump-storage
        persistentVolumeClaim:
          claimName: heapdump-pvc
---
apiVersion: v1
kind: PersistentVolumeClaim
metadata:
  name: heapdump-pvc
spec:
  accessModes:
    - ReadWriteOnce
  resources:
    requests:
      storage: 10Gi
This practical FinOps playbook shows you exactly how to build visibility, enforce accountability, and automate rightsizing from day one.
Real-world dump naming with timestamps
-XX:HeapDumpPath=/heapdumps/java_pid%p_%t.hprof
This creates dumps like java_pid1_2024-01-15_14-30-45.hprof, including process ID and timestamp for easy identification.
Monitoring dump generation
Check for generated dumps after pod restarts:
kubectl exec my-web-app-7d4b9c8f-new-pod -- ls -lh /heapdumps/
# Output: -rw-r--r-- 1 app app 847M Jan 15 14:30 java_pid1_2024-01-15_14-30-45.hprof
Storage considerations:
Plan for storage requirements based on heap sizes. A 1GB heap limit requires 3-5GB dump storage, while 4GB heaps need 10-15GB reserve capacity. Production clusters should implement automated cleanup using Kubernetes CronJob resources—scheduled tasks that run containers at specified intervals to perform maintenance operations.
Here’s an example Kubernetes CronJob that removes heap dumps older than 30 days from shared volumes:
apiVersion: batch/v1
kind: CronJob
metadata:
  name: heapdump-cleanup
spec:
  schedule: "0 3 * * *"  # Daily at 3 AM
  jobTemplate:
    spec:
      template:
        spec:
          containers:
          - name: cleanup
            image: busybox
            command:
            - /bin/sh
            - -c
            - find /heapdumps -name "*.hprof" -mtime +30 -delete
            volumeMounts:
            - name: heapdump-storage
              mountPath: /heapdumps
          volumes:
          - name: heapdump-storage
            persistentVolumeClaim:
              claimName: heapdump-pvc
          restartPolicy: OnFailure
This CronJob runs a cleanup container daily at 3:00 AM, accessing the same persistent volume where heap dumps are stored and automatically deleting files older than 30 days.
Trigger an intentional OOM to verify dump collection
kubectl exec -it my-web-app-7d4b9c8f-xk2m9 -- \
  java -Xmx100m -XX:+HeapDumpOnOutOfMemoryError \
  -XX:HeapDumpPath=/tmp/ \
  -cp /app OutOfMemoryTest
This approach verifies that heap dumps capture the exact memory state when applications fail, providing crucial debugging information for production issues. It also validates dump strategies to prevent failure in production environments.
Programmatic heap dumps
Applications can expose heap dump capabilities through REST endpoints, enabling remote triggering based on monitoring alerts or performance thresholds.
Basic REST endpoint
@RestController
public class DiagnosticController {
    @PostMapping("/admin/heap-dump")
    public ResponseEntity<String> createHeapDump() throws Exception {
        HotSpotDiagnosticMXBean hotspotMBean = ManagementFactory
            .getPlatformMXBean(HotSpotDiagnosticMXBean.class);

        String filename = "/tmp/api-dump-" + System.currentTimeMillis() + ".hprof";
        hotspotMBean.dumpHeap(filename, true);

        return ResponseEntity.ok("Heap dump created: " + filename);
    }
}
Triggering dumps remotely
kubectl port-forward my-web-app-7d4b9c8f-xk2m9 8080:8080
curl -X POST https://localhost:8080/admin/heap-dump
# Response: Heap dump created: /tmp/api-dump-1705322625000.hprof
Programmatic triggering enables on-demand heap dump collection without requiring pod access or container restarts. Test programmatic dump generation thoroughly in development and staging environments to understand performance impacts and identify memory leak patterns before deploying to production. Add rate limiting in production to prevent excessive dump generation during high-frequency monitoring alerts.
Practical heap dump collection techniques
Note the following commands.
Basic pod access
Use interactive shell access for manual troubleshooting and heap dump collection:
# Interactive shell access
kubectl exec -it my-web-app-7d4b9c8f-xk2m9 -- /bin/bash

# For minimal containers without bash
kubectl exec -it my-web-app-7d4b9c8f-xk2m9 -- /bin/sh

# Multi-container pods
kubectl exec -it my-web-app-7d4b9c8f-xk2m9 -c java-app -- /bin/bash
Finding Java processes
Identify the Java process ID before running diagnostic tools:
# Using jps (if JDK tools available)
jps -v
# Output: 1 MyWebApplication -Xmx2048m -jar app.jar

# Using ps command
ps aux | grep java
# Output: app 1 0.0 12.5 3243616 507904 ? Ssl 14:30 0:23 java -jar app.jar

# Extract PID using awk
ps aux | grep java | grep -v grep | awk '{print $2}'
# Output: 1
Non-interactive commands for scripting
Execute diagnostic commands directly without shell access for automation.
# Get Java PID directly
kubectl exec my-web-app-7d4b9c8f-xk2m9 -- ps aux | grep java | grep -v grep | awk '{print $2}'

# Generate heap dump in one command
kubectl exec my-web-app-7d4b9c8f-xk2m9 -- \
  jmap -dump:live,format=b,file=/tmp/heap.hprof $(pgrep java)
Most containerized Java applications run as PID 1, but verify with ps aux when multiple processes exist. Single-JAR deployments typically show one Java process, while application servers may run multiple JVMs.
Storage and file management
Heap dumps can consume significant disk space, often several gigabytes for production applications. Check available space with the following command before generating dumps to avoid filling container filesystems.
df -h /tmp
# Output: /dev/sda1 5.0G 2.1G 2.9G 42% /tmp
Use /tmp directories for temporary dumps, but remember that container restarts will lose this data.
Persistent volume integration helps heap dumps survive pod lifecycles. Configure persistent volume claims in your deployment.
spec:
  containers:
  - name: java-app
    volumeMounts:
    - name: heapdump-storage
      mountPath: /heapdumps
  volumes:
  - name: heapdump-storage
    persistentVolumeClaim:
      claimName: heapdump-pvc
Transferring and managing heap dump files
Some strategies for managing heap dump files are given below.
File extraction methods
1. Copy heap dumps directly from pods to your local filesystem for analysis.
kubectl cp my-web-app-7d4b9c8f-xk2m9:/tmp/heap.hprof ./local-heap.hprof
2. Compare file sizes before and after transfer to ensure complete copying.
# Check file size before transfer
kubectl exec my-web-app-7d4b9c8f-xk2m9 -- ls -lh /tmp/heap.hprof
# Output: -rw-r--r-- 1 app app 847M Jan 15 14:30 heap.hprof

# After transfer, compare sizes
ls -lh local-heap.hprof
# Output: -rw-r--r-- 1 user user 847M Jan 15 14:35 local-heap.hprof
Alternatively, you can also set up an HTTP file server inside the pod when direct copy fails or for multiple file access:
kubectl exec my-web-app-7d4b9c8f-xk2m9 -- python3 -m http.server 8000 -d /tmp &
kubectl port-forward my-web-app-7d4b9c8f-xk2m9 8080:8000
# Access via browser: https://localhost:8080/heap.hprof
Depending on network speed and file size, large heap dumps may take several minutes to transfer.
Cloud storage integration
When running workloads in the cloud, we can leverage cloud storage and other cloud capabilities.
Upload dumps directly to cloud storage from within pods using cloud provider CLI tools. Install AWS CLI, Google Cloud SDK, or Azure CLI in container images, then configure service accounts or IAM roles for authentication. This approach eliminates large file transfers through local machines, improving efficiency and security.
Example with AWS S3
Install and use cloud CLI tools in your container images to enable direct uploads from pods
# AWS S3 upload from inside pod
aws s3 cp /tmp/heap.hprof s3://my-heapdump-bucket/$(date +%Y%m%d)/
Configure lifecycle policies in the S3 cloud storage to automatically delete heap dumps after a specified period. This prevents storage costs from accumulating as heap dumps can consume significant space over time:
# AWS S3 lifecycle rule (via AWS CLI)
aws s3api put-bucket-lifecycle-configuration \
  --bucket my-heapdump-bucket \
  --lifecycle-configuration file://cleanup-policy.json
Define specific retention rules that balance debugging needs with cost control. This example policy automatically deletes heap dumps older than 30 days (cleanup-policy.json)
{
  "Rules": [{
    "ID": "DeleteOldHeapDumps",
    "Status": "Enabled",
    "Expiration": {"Days": 30}
  }]
}
This approach eliminates bandwidth costs and storage limitations when transferring multi-gigabyte heap dumps through local machines.
Heap dump analysis workflow
Key considerations for examining your heap dump file.
Popular analysis tools
Eclipse Memory Analyzer Tool (MAT) provides comprehensive heap dump analysis capabilities. Download MAT from Eclipse.org and import heap dumps using File > Open Heap Dump. The initial overview report shows total memory usage, object counts, and automatic leak suspect identification. Navigate through the dominator tree to understand object retention patterns.
JProfiler offers commercial heap dump analysis with advanced visualization features. VisualVM, included with Oracle JDK distributions, provides basic heap analysis capabilities suitable for initial investigations.
Command-line tools like jhat work in server environments but offer limited analysis depth compared to GUI alternatives.
Key metrics
Examine the following.
Memory usage patterns
Sort the dominator tree by retained heap size. Objects retaining >10% of the total heap indicate problems.
Object retention analysis
Use “Path to GC Roots” to trace retention chains. Example finding:
com.myapp.cache.UserCache @ 0x7f8a4c000000
└── retaining 800MB through strong references to expired entries
GC behaviour
Applications with frequent full GC cycles but minimal memory reclamation suffer from retention issues. High allocation rates between young collections suggest object creation hotspots.
Typical findings in Kubernetes environments
| Pattern | Reason |
| Container memory mismatch | Applications with -Xms4g -Xmx4g in 2GB containers trigger immediate OOMKilled termination during JVM startup when the initial heap allocation exceeds container limits. Instead of fixed heap sizes, use-XX:MaxRAMPercentage=75.0. |
| String duplication explosion | Environment processing creates duplicate strings, consuming 30-40% of heap space. A 500MB heap might contain 150MB of identical database connection strings. |
| Framework retention issues |
|
| Collection undersizing | HashMap objects with load factors near 1.0 indicate frequent resizing. Default 16-element maps storing thousands of entries cause fragmentation within container constraints. |
Once you’ve identified memory patterns through heap dump analysis, consider implementing automated rightsizing that understands Java-specific memory behaviour.
This approach combines the diagnostic power of heap dumps with automated rightsizing that understands Java-specific memory behaviour. It enables more precise resource recommendations that avoid memory-related failures and resource waste.
Production considerations and best practices
Some things to note when implementing heap dump collection in a production environment.
Performance and timing considerations
Heap dump collection pauses all application threads during generation, potentially lasting 5-15 seconds for multi-gigabyte heaps. Schedule collection during maintenance windows or configure circuit breakers to handle temporary unresponsiveness.
# Off-hours automated collection
0 2 * * * /scripts/conditional-heap-dump.sh memory-threshold-90
Monitor GC logs before and after dump generation. Applications experiencing memory pressure may trigger full GC cycles immediately after dump completion, extending the performance impact window.
Development workflow integration
Include heap dump simulation in CI/CD pipelines to verify that collection mechanisms work correctly. Test dump generation under various memory conditions during staging deployments.
Pipeline verification example:
# Test heap dump generation in staging
kubectl exec $POD_NAME -- jmap -dump:format=b,file=/tmp/test.hprof $(pgrep java)
kubectl exec $POD_NAME -- test -f /tmp/test.hprof && echo "SUCCESS" || echo "FAILED"
Troubleshooting common issues
Solutions to common problems are given below.
Insufficient privileges error
Error: Permission denied to attach to process
Solution – Verify the container runs with appropriate user permissions or add SYS_PTRACE capability:
securityContext:
  capabilities:
    add: ["SYS_PTRACE"]
Disk space exhaustion
Cannot create heap dump: No space left on device
Solution – Check available space before collection and use compressed dumps when possible:
df -h /tmp && jmap -dump:live,format=b,file=/tmp/compressed.hprof $(pgrep java)
JVM compatibility and tool issues
If missing diagnostic tools in minimal containers: Install JDK tools using init containers or sidecar patterns:
initContainers:
- name: jdk-tools
  image: openjdk:11-jdk
  command: ['cp', '/usr/bin/jmap', '/shared/tools/']
  volumeMounts:
  - name: tools-volume
    mountPath: /shared/tools
JVM version mismatches: OpenJDK 11+ heap dumps may not open correctly in older analysis tools. Verify MAT version compatibility:
- OpenJDK 8: MAT 1.8+
- OpenJDK 11: MAT 1.9+
- OpenJDK 17: MAT 1.11+
The airline analogy translates complex cluster economics into language your execs, engineers, and FinOps teams can all understand.
Conclusion
Java heap dump collection in Kubernetes requires understanding both JVM diagnostic tools and container orchestration concepts. Manual collection with jmap and jcmd provides immediate troubleshooting capabilities, while automated approaches using JVM flags enable consistent error capture. Programmatic heap dumps through JMX integration support advanced monitoring and alerting workflows.Effective heap dump analysis identifies memory leaks, guides JVM tuning decisions, and improves overall application stability. As Java applications scale across multiple pods and clusters, the insights gained from heap dump analysis become increasingly valuable for optimizing resource allocation and maintaining reliable services. The techniques covered in this article provide a foundation for systematic memory troubleshooting in containerized Java environments.
Related Blogs

Does Your Multi-Cloud Stack Need a Control Plane?
Most infrastructure teams never decide to run a dozen tools across three clouds. It accumulates, one reasonable choice at a…