Kubernetes Cost Allocation: Practical Strategies for Namespaces, Attribution, and Chargeback
Shared Kubernetes cluster infrastructure creates an ownership problem. When multiple teams run workloads on the same node pool, the underlying compute, storage, and network resources don’t belong to any one team in particular. A pod scheduled by the payments team might land on the same node as a batch job from the data science team. Resource requests draw a boundary around what each pod reserves, but consumption above those requests comes out of shared node headroom, and the node is billed as one flat hourly charge no matter who used it. At the end of the month, a single cloud bill arrives with instance costs, network transfer fees, and managed service charges, none of which map cleanly to the teams that generated them.
Kubernetes cost allocation translates that shared spend into team-, application-, or customer-level charges. It requires combining pod-level resource metrics with cloud billing data, applying distribution logic for infrastructure that no single team owns, and delivering that information in a format that finance teams can act on.
This article examines practical Kubernetes cost allocation implementation strategies across five areas: namespace hierarchies, attribution methods, shared cost distribution, multi-cloud reconciliation, and chargeback automation.
Summary of key Kubernetes cost allocation concepts
The table below summarizes the five key Kubernetes cost allocation concepts this article will explore in detail.
| Concept | Description |
|---|---|
| Namespace-based allocation hierarchies | Namespaces serve as logical cost boundaries that map to teams, applications, or customer tenants. Label-based aggregation supports hierarchical rollups, though shared system namespaces and cross-namespace dependencies require specialized distribution logic. |
| Resource request and usage attribution methods | Charges can be based on reserved resource requests, actual pod consumption, or hybrid models combining both. Request-based allocation provides billing predictability while usage-based allocation rewards efficiency but introduces invoice volatility. |
| Shared infrastructure cost distribution | Control planes, monitoring stacks, and ingress controllers serve all tenants without belonging to specific namespaces. Distribution approaches include proportional allocation, equal splits, and service-specific keys that match overhead to the teams generating it. |
| Multi-cloud billing reconciliation | Organizations running EKS, AKS, and GKE must map provider-specific billing formats to unified Kubernetes allocation models, normalizing pricing across providers and categorizing unallocated fees, such as network transfer and managed service charges. |
| Automated chargeback and showback systems | Production allocation requires pipelines that continuously collect pod metrics, apply allocation rules, reconcile cloud bills, and generate reports. Integration with financial systems and self-service dashboards removes the need for manual reconciliation. |
CloudBolt delivers continuous Kubernetes rightsizing at scale—so you eliminate overprovisioning, avoid SLO risks, and keep clusters efficient across environments.
Why Kubernetes cost allocation is inherently approximate
Before committing engineering time to allocation tooling, it helps to understand why perfect attribution is impossible and what “good enough” actually means.
Kubernetes was designed for scheduling efficiency, not cost transparency. The scheduler places pods based on requests, spreading workloads across nodes to maximize utilization. For example, a single m5.2xlarge instance running in your EKS cluster might host pods from three different teams at different times throughout the day, with each pod consuming different amounts of CPU and memory at each moment. The AWS bill for that instance is a flat hourly charge. Mapping that charge back to three teams requires tracking pod scheduling history, resource consumption at sub-minute intervals, and node occupancy over time.
Several structural factors compound this:
- Idle node capacity reserves headroom for scheduling and consumes real compute budget without producing workload output
- Platform components like service meshes, logging agents, and CSI drivers run cluster-wide but generate costs proportional to tenant activity in non-obvious ways
- Autoscaling events continuously reshape which nodes exist and how workloads distribute across them, making snapshot-based attribution unreliable
- Cloud bills present costs at the instance level, while Kubernetes operates at the pod level, with no native join between the two
The goal of a cost allocation system is not byte-for-byte accuracy in how the cost of a node is split between the pods that shared it. It’s a defensible, consistent methodology that both engineering and finance teams understand and agree to use. The total is a different matter. Allocated costs should still reconcile to the actual cloud bill, with every dollar attributed to a team or an explicit overhead bucket rather than lost in an unexplained gap. Approximation is tolerable in the split, not in the sum.
Namespace-based Kubernetes cost allocation hierarchies
Most clusters already use namespaces to separate environments and teams. The challenge is that namespaces alone don’t carry enough context for financial reporting. A namespace named backend-prod tells you the environment, but not the business unit, cost center, or customer it belongs to.
The labeling problem
Kubernetes labels taxonomy is the foundation of cost allocation. If labels are inconsistent across teams, the allocation pipeline is unreliable. A pod in payments-prod with team=payments-team and another with team=payments are invisible to each other in an aggregation query that groups by exact label match. To avoid the problems associated with poor tagging practices, define and enforce a standard label schema before building allocation logic. A minimal viable schema looks like this:
# Namespace label schema for cost allocation
apiVersion: v1
kind: Namespace
metadata:
  name: payments-prod
  labels:
    team: payments          # owning team
    bu: fintech             # business unit for rollup
    env: prod               # environment tier
    cost-center: "CC-1042"  # finance cost center ID
    customer: ""            # MSP tenant ID if applicable
With consistent labels, an allocation system can roll costs up by any dimension. A query grouping by bu shows division-level costs. A query grouping by cost-center feeds into ERP charge codes. A query grouping by customer generates per-tenant MSP invoices.
Cross-namespace dependencies
Labeling namespaces handles owned workloads cleanly. It breaks down when a frontend service in checkout-prod depends on a shared user-service running in platform-prod. The user-service pods consume CPU and memory serving checkout traffic, but those costs are billed to the platform team’s namespace.
Service-mesh telemetry from Istio or Linkerd exposes traffic volumes across namespaces. A simple Prometheus query against Istio metrics reveals what percentage of user-service requests come from each upstream namespace:
# Percentage of user-service traffic by upstream namespace
sum by (source_workload_namespace) (
  rate(istio_requests_total{
    destination_service_name="user-service",
    destination_namespace="platform-prod"
  }[1h])
)
/
sum(
  rate(istio_requests_total{
    destination_service_name="user-service",
    destination_namespace="platform-prod"
  }[1h])
)
That ratio serves as the key for allocating a portion of platform-prod’s user-service costs to the namespaces consuming it. Most teams skip this complexity in early implementations and treat shared platform services as overhead distributed proportionally. That’s a reasonable starting point. The cross-namespace attribution layer matters most when platform services account for a significant fraction of total cluster costs.
Multi-cluster aggregation
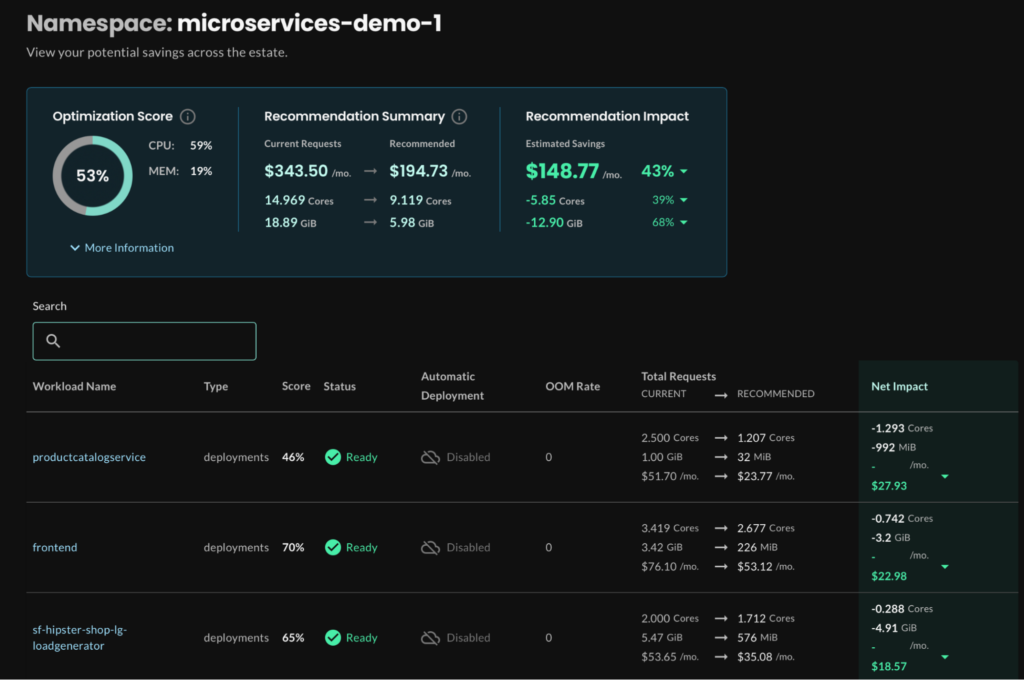
When teams run the same application across EKS in us-east-1 and AKS in westeurope, namespace names may match, but underlying costs don’t. Unified reporting requires normalizing costs across clusters before aggregating. Kubecost handles this with a federated ETL that merges per-cluster data, and OpenCost exports costs per cluster for downstream aggregation. CloudBolt’s Kubernetes cost allocation handles cross-cluster federation with an agent-based approach: the same agent runs on every cluster, whether EKS, AKS, GKE, or OpenShift, and the data is normalized into a single cost view across clusters and clouds.
Resource request and usage attribution methods
Labels define who owns a workload. Attribution methods define what you charge them for. This is where most Kubernetes cost allocation implementations make their first consequential trade-off.
The over-provisioning incentive problem
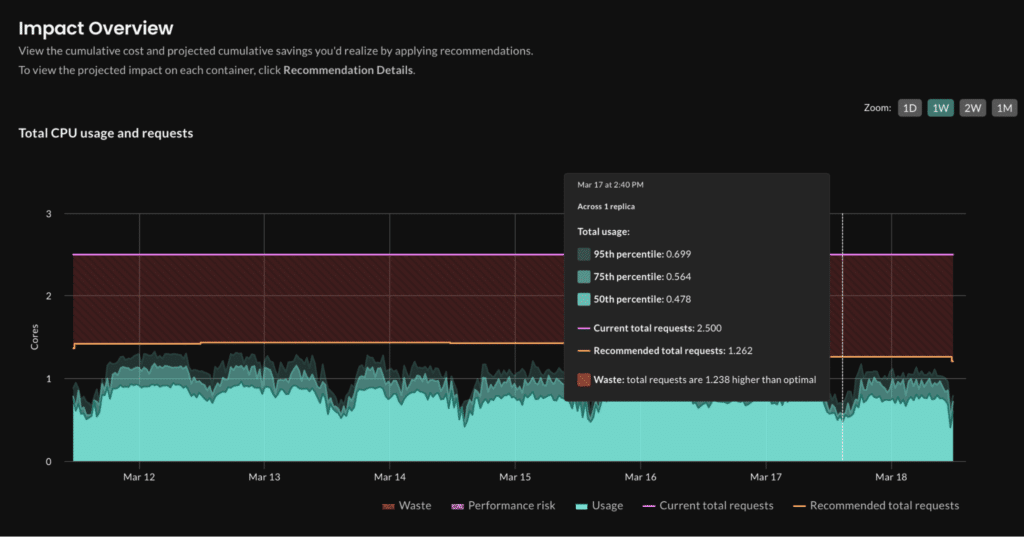
Suppose you charge teams for actual CPU usage. A team running a latency-sensitive service requests 4 CPU cores to handle traffic spikes, but typically consumes 0.8. Under usage-based billing, they pay for 0.8. Requesting 4 cores costs them nothing extra, so there’s no incentive to rightsize. Over time, the cluster fills with oversized requests and utilization drops. Node counts climb. The bill goes up for everyone.
Request-based attribution flips this dynamic. Teams pay for what they reserved, not what they consumed. Requesting 4 cores while using 0.8 means paying for 3.2 cores of waste. That financial signal drives teams to review their resource requests and align them more closely with actual consumption.
The three main approaches to attribution are:
Request-based allocation uses pod spec.containers[*].resources.requests values from the Kubernetes API. It’s stable, predictable, and produces consistent invoices regardless of workload behavior. The downside is that it doesn’t reflect actual consumption, so a team running highly efficient workloads pays the same as a team running wasteful ones at the same request level.
Usage-based allocation reads actual CPU and memory consumption from container_cpu_usage_seconds_total and container_memory_working_set_bytes in Prometheus. It accurately reflects what workloads are consumed, but consumption fluctuates with traffic patterns. A team whose application autoscales during business hours will see costs spike during those windows. Smoothing with a 95th percentile over a weekly window reduces volatility without hiding sustained overconsumption.
Hybrid models combine both signals. A common starting configuration weights requests at 70% and usage at 30%. Teams with well-tuned resource requests see minimal difference between the two signals and stable invoices. Teams with large gaps between requests and usage pay a usage premium that creates gradual rightsizing pressure without punishing them entirely for a single spike.
Shared infrastructure cost distribution
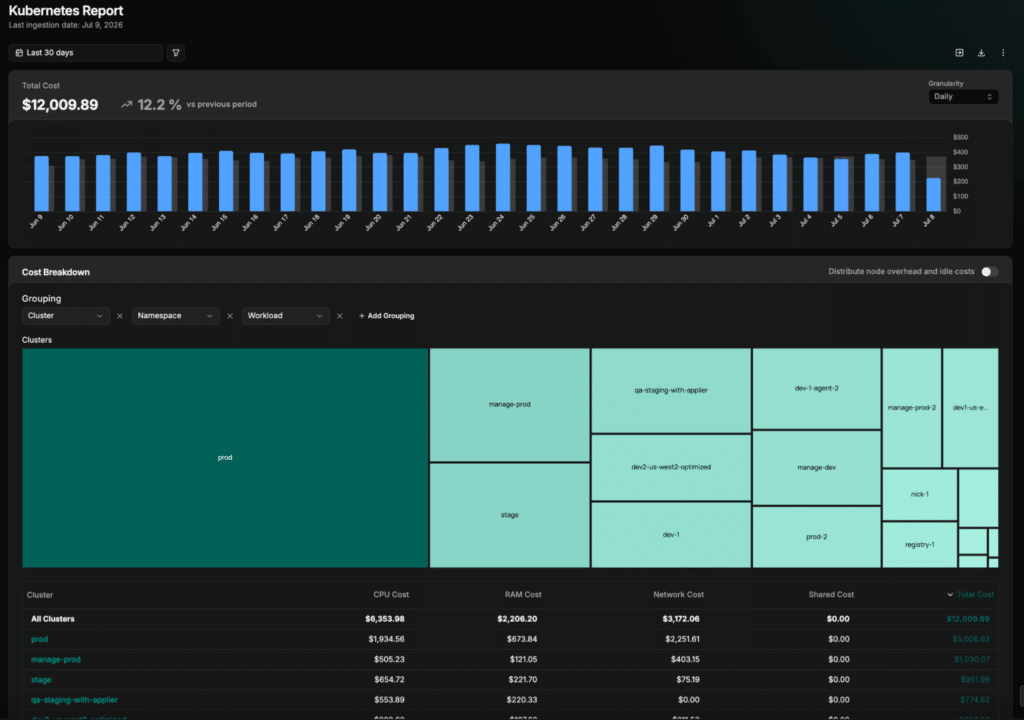
Every cluster runs services that nobody owns, but everyone uses. Control planes, monitoring stacks, log aggregators, and ingress controllers generate real cloud spend but don’t belong to any workload namespace. Without explicit handling, these costs are not reflected in allocation reports. They get quietly absorbed by the platform team or simply go missing from the total.
The key idea here is to separate shared costs into three categories with distinct distribution logic. Treating them as a single bucket forces you into a one-size-fits-all distribution method that is inaccurate for most of them.
Cluster platform overhead includes managed control-plane charges that appear in cloud bills but not in pod metrics. EKS bills $0.10 per cluster per hour, AKS charges similarly for paid tiers, and GKE applies the same $0.10 management fee to both Standard and Autopilot clusters. Autopilot changes how compute is billed, charging per pod resource request rather than per node, but the cluster-level fee is identical. For a cluster running continuously, that is roughly $72 per month before any compute costs. For smaller clusters, this represents 10-20% of total spend. Proportional distribution based on namespace resource consumption is the most defensible approach: if namespace A accounts for 40% of total cluster CPU and memory requests, it bears 40% of the control plane charge.
Shared services like Prometheus, Grafana, and the ingress controller run in dedicated namespaces (monitoring, kube-system, ingress-nginx). Simple proportional distribution works for most of them. For services where consumption clearly correlates with a measurable proxy, use that proxy instead:
| Shared service | Proportional key |
|---|---|
| Log aggregation (Fluentd/Loki) | Log volume in bytes per namespace |
| Metrics collection (Prometheus) | Active time series per namespace |
| Ingress controller | HTTP request count per namespace |
| Service mesh (Istio) | Network bytes transferred per namespace |
| Control plane | CPU + memory requests per namespace |
Idle capacity is the hardest category. Clusters keep headroom available for scheduling, typically 15-30% of total node capacity, depending on workload variability. That idle capacity costs money. The two main treatments are absorbing it as a platform cost (the platform team bears it, tenants don’t see it) or distributing it proportionally across namespaces. Whichever you choose, document it. Teams will ask why their allocation adds up to less than the total cloud bill, and “we absorb idle capacity centrally” is a legitimate and explainable answer.
Multi-cloud billing reconciliation
Now here is where things get complicated. Suppose the payments team runs on EKS in one region and AKS in another for latency reasons. They want a single cost report. You have two cloud bills in completely different formats, neither of which mentions Kubernetes namespaces, pods, or teams.
The mechanism behind reconciliation is straightforward in concept. AWS bills EC2 instances by instance type, availability zone, and purchasing model. Azure bills Virtual Machine instances by VM size and region. Neither cloud surfaces pod-level data in its billing export. To map instance costs to pods, you need a system that continuously tracks which pods ran on which nodes, for how long, and what fraction of each node’s resources they consumed.
What actually happens under the hood looks like this:
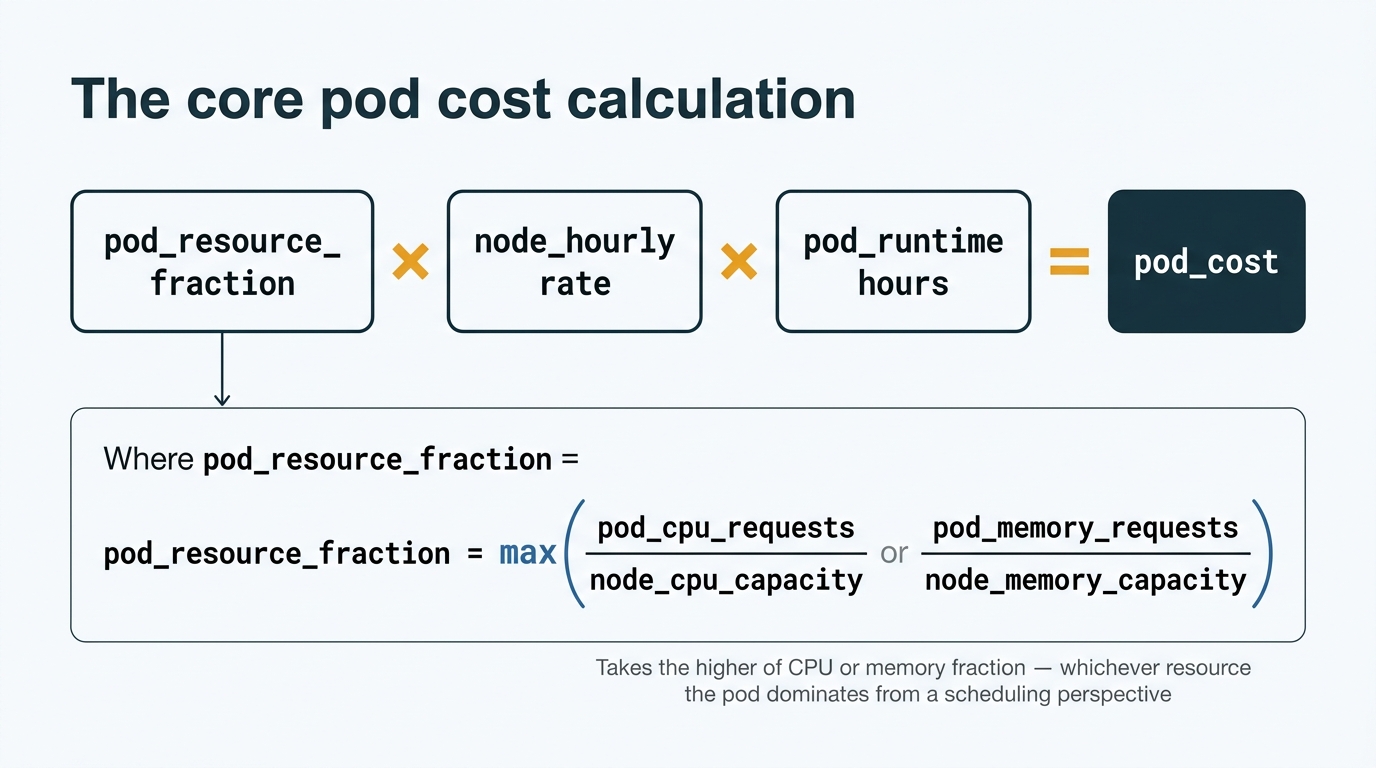
The max() function captures that a pod requesting 80% of a node’s CPU but only 10% of its memory effectively holds 80% of that node from a scheduling perspective. Teams that pack nodes with memory-intensive workloads should not subsidize teams running CPU-intensive workloads at a lower rate.
This practical FinOps playbook shows you exactly how to build visibility, enforce accountability, and automate rightsizing from day one.
Rate card normalization
Different node types across providers need a common unit of measurement. Build a rate card that converts each provider’s instance costs into CPU-hour and memory-GiB-hour rates. Update it whenever Reserved Instance purchases, Savings Plans, or Committed Use Discounts change your effective rates. Without normalization, a cost comparison between an EKS cluster running m5.2xlarge instances and an AKS cluster running Standard_D8s_v3 VMs requires manual conversion every time.
Unallocated costs
Network egress between availability zones, NAT gateway charges, and load balancer fees appear in cloud bills but don’t map to pods. These require explicit categorization:
- Attributable by proxy: AZ-to-AZ egress can be distributed by namespace based on Istio cross-zone traffic metrics
- Cluster overhead: Load balancer costs can be distributed proportionally by namespace service count
- Absorbed centrally: Some costs are too indirect to attribute reliably and belong in a platform overhead bucket
Put differently, not every line item on the cloud bill needs a pod-level owner. The goal is to categorize them deliberately rather than letting them accumulate in an unexplained gap between total cluster costs and total allocated costs.
CloudBolt’s cost allocation and chargeback platform handles this reconciliation across EKS, AKS, and GKE, normalizing provider billing formats into a unified allocation model. The Kubernetes cost optimization guide covers the broader optimization strategies that reduce total cluster spend before allocation even starts.
Automated chargeback and showback systems
A manual allocation process breaks at scale. Let’s walk through what that actually looks like. A FinOps engineer spends three days every month pulling Prometheus data, joining it against cloud billing exports in a spreadsheet, and emailing reports to team leads. At 10 namespaces, it is painful but manageable. At 50 namespaces, it fails completely. The process becomes the bottleneck, reports arrive late, and teams stop trusting the numbers because they can’t verify the methodology.
The pipeline architecture
The sequence of a production allocation pipeline typically looks like this:
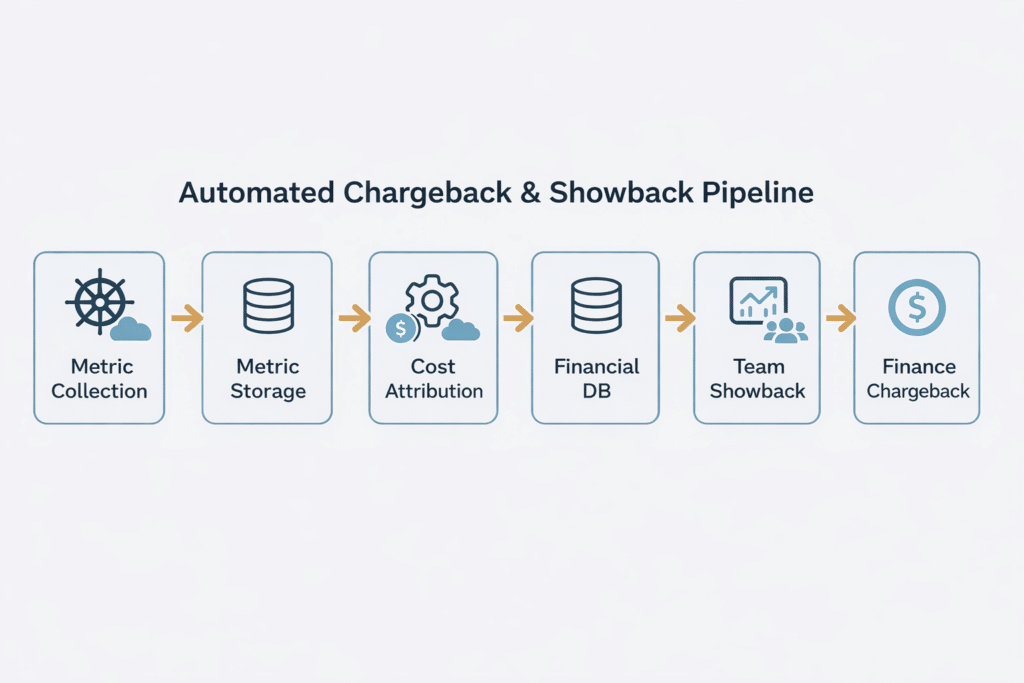
Each stage has failure modes. Prometheus scrape gaps produce missing cost data for the affected period. Cloud billing exports arrive 24-48 hours late, so same-day allocation reports are estimates until the bill reconciles. Misconfigured allocation rules during a namespace migration produce incorrect reports for the affected period. Production pipelines need audit logs that capture which rules applied during each billing window so disputed charges can be investigated against a historical record.
At minimum, each audit entry should record the rule version in effect, the billing window start and end dates, and a snapshot of the pod metrics used as inputs. For managed service providers running multi-tenant clusters, the same pipeline extends to support customer cost isolation, margin application, and white-labeled reporting.
Self-service visibility
The most valuable shift a mature allocation system produces is moving cost feedback from monthly reports to daily access. When a developer can open a dashboard and see that their namespace spent $340 yesterday against a $250 daily average, they investigate before it becomes a billing dispute. When an anomaly alert fires because a namespace’s hourly cost tripled after a deployment, the team can correlate it with a resource limit misconfiguration before the bill arrives.
This changes the FinOps team’s role. Instead of producing and defending reports, they maintain the platform and let teams operate within it. Budget alerts, per-namespace cost trends, and deployment-correlated cost spikes become team-level tools rather than central reporting outputs.
The airline analogy translates complex cluster economics into language your execs, engineers, and FinOps teams can all understand.
Conclusion
“The perfect is the enemy of the good” holds very true in the case of Kubernetes cost allocation. It is fundamentally an approximation problem. The goal is not to achieve perfect accounting of every CPU cycle and byte of memory; it’s to produce an allocation that’s accurate enough to drive the right behaviors: teams rightsize their resource requests, shared infrastructure costs are distributed fairly, and finance teams get invoice-ready data without manual reconciliation.
The implementation path follows a logical sequence. Start with namespace boundaries and label taxonomy before building any allocation logic. Choose an attribution model that matches your organization’s financial culture. Handle shared costs explicitly with documented distribution rules. Reconcile multi-cloud billing through normalized rate cards. Then automate the entire pipeline so that allocation happens continuously rather than as a month-end scramble.
CloudBolt’s Kubernetes cost allocation and its broader FinOps platform address these layers across multi-cloud and multi-cluster environments, from pod metric collection through financial system integration. The tooling matters, but the allocation model you define matters more. Get the model right first, then automate it.